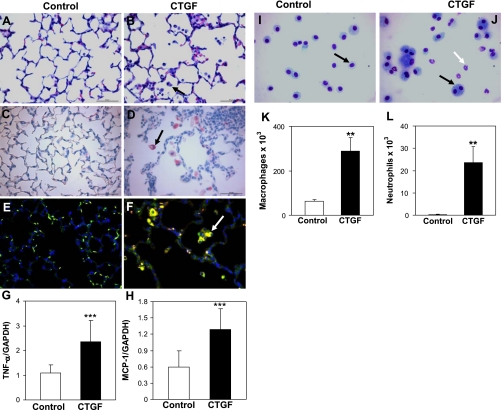
Fig. 5.
CTGF induced lung inflammation. Histological examination on HE-stained lung tissue sections revealed dramatic infiltration in 2-wk-old CTGF lungs (B, arrow) compared with control lungs (A). Immunostaining for Mac3 demonstrated a significant increase macrophage infiltration in alveolar air spaces in CTGF lungs (D, arrow) compared with control lungs (C) [13.08 ± 4.35 vs. 1.43 ± 0.22 per high-power field (HPF), n = 4/group, **P < 0.001]. Double immunofluorescence staining for Mac3 (green signal) and MCP-1 (red signal) detected increased MCP-1 expression in infiltrated macrophages in CTGF lungs (yellow signal, arrow, F) compared with control lungs where MCP-1 was undetectable (E). Real-time RT-PCR demonstrated increased gene expression of TNF-α and MCP-1 in CTGF lungs (G and H). Bronchoalveolar lavage (BAL) was performed in 4-wk-old control and CTGF mice. Neat hematology stain identified only macrophages in BAL cytospin from control mice (I). However, multinucleated gain cells (black arrow) and neutrophils (white arrow) were detected in BAL cytospin from CTGF mice (J). Quantification of macrophages (K) and neutrophils (L) were both significantly increased in CTGF lungs. N = 4/group. **P < 0.001 and ***P < 0.05. Magnification: ×40. Scale bars: 50 μm.

