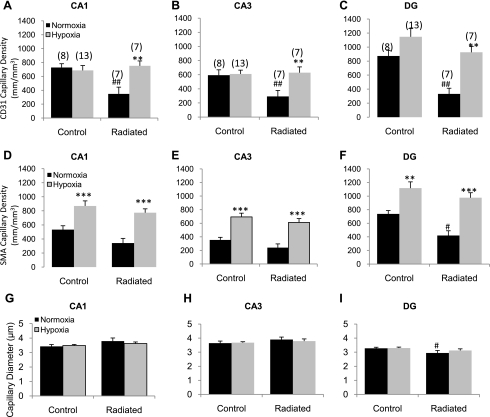
Fig. 4.
Changes in capillary density within subregions of the hippocampus. Sections were stained using CD31 antibody and imaged using confocal microscopy. Capillaries were defined as blood vessels <10 μm in diameter. Capillaries were traced using Neurolucida and quantified as length of vessel per volume of tissue (as described in materials and methods). CD31 capillary density in CA1 (A), CA3 (B), and DG (C). SMA capillary density in CA1 (D), CA3 (E), and DG (F). Capillary diameter in CA1 (G), CA3 (H), and DG (I). Data indicate profound capillary rarefaction in all regions assessed in response to WBRT and complete recovery of density with hypoxia. Data represent means ± SE. **P < 0.01 and ***P < 0.001 vs. the normoxic group and #P < 0.05 and ##P < 0.01 vs. control-normoxic; the number of animals per group is indicated in parentheses.

