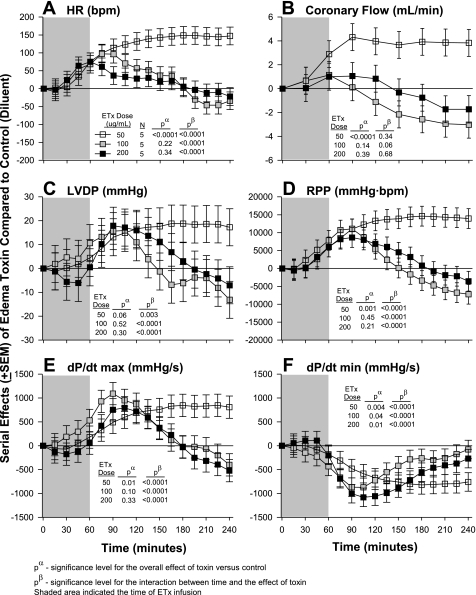
Fig. 2.
Serial effects (means ± SE) of three doses of ETx (50, 100, and 200 ng/ml) compared with controls on HR (A), coronary flow (B), LVDP (C), RPP (D), LV dP/dtmax (E), and LV dP/dtmin (F) in a nonrecirculating model. The shaded area represents when toxin was administered. Levels of significance are shown for the overall effect of toxin with placebo versus control (no toxin) (pα) and the interaction between these effects and time (pβ). As described in materials and methods, for statistical analysis serial changes from baseline with ETx were compared with serial changes from baseline in controls. However, for clarity in A–F, the serial effects of challenge (i.e., toxin minus control) are shown.

