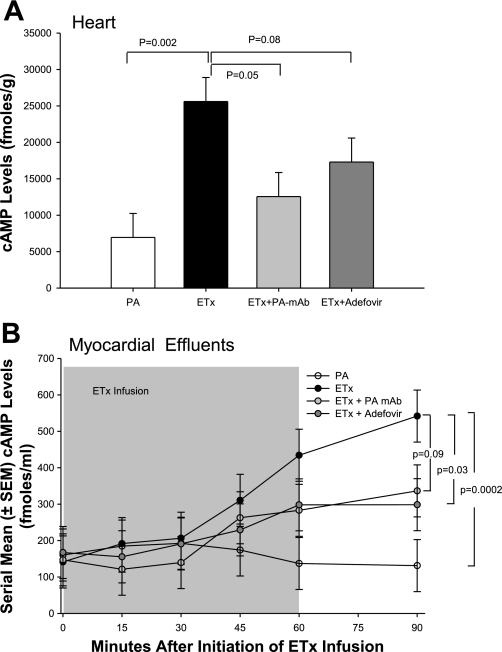
Fig. 6.
A: cAMP levels (means ± SE) in myocardial tissue 30 min after the completion of 60 min of perfusion with PA alone, ETx alone, or ETx with PA mAb or adefovir. B: serial cAMP levels (means ± SE) in the effluent from hearts perfused for 60 min with PA alone, ETx alone, or ETx with PA mAb or adefovir. The shaded area denotes the time of toxin infusion.

