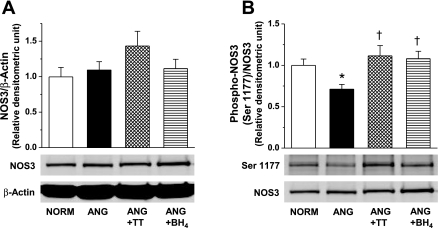
Fig. 5.
Representative Western blot and relative densitometry analysis of total NOS3 normalized to β-actin (A) and NOS3 phosphorylation at Ser1177 normalized to total NOS3 (B) in small mesenteric arteries from NORM (n = 12), ANG (n = 13), ANG + TT (n = 5), and ANG + BH4 (n = 5). *Significant difference vs. NORM (P ≤ 0.05). †Significant difference vs. ANG (P ≤ 0.05).

