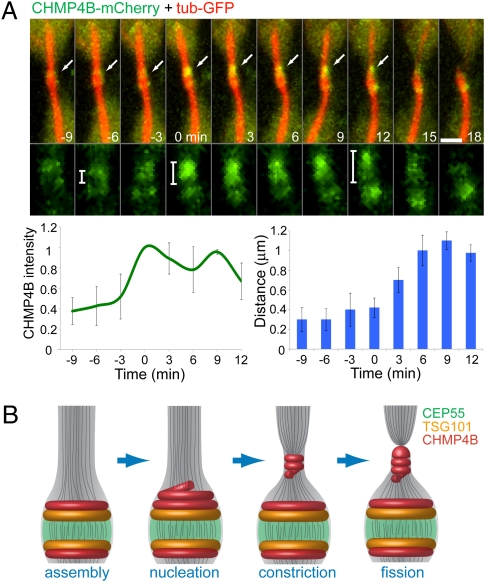
Fig. 5.
Suggested model for ESCRT-mediated abscission. (A) MDCK cells expressing CHMP4B-mCherry (green) and α-tubulin–GFP (red) were imaged during late cytokinesis at 3-min intervals. (Upper) The images shown are sequential frames of the merged image (upper row) and the CHMP4B channel alone (lower row). (Scale bars: 2 μm.) (Lower Left) The graph shows the change in CHMP4B intensity on the side that is about to break. (Lower Right) The graph shows the distance between the highest-intensity CHMP4B pixel and the lowest-intensity CHMP4B pixel (located between the two initial rings) measured from a line intensity profile plotted along the midbody bridge on the side that is about break. This measurement was used as an indication of the location of the second CHMP4B pool relative to the center of the midbody. Time 0 was determined as the time CHMP4B intensity reached its maximal value. n = 5. (B) Suggested model for ESCRT-mediated constriction and fission during cytokinetic abscission. Assembly of CEP55 (green), TSG101 (yellow), and CHMP4B (red) at the midbody center forms a platform for initiation of abscission. Closer to abscission, ESCRTIII levels increases at the midbody and then relocalizes to the constriction zones, probably by polymerizing into a spiral. This relocalization induces constriction that is followed by breakage of the intercellular bridge, leading to complete separation of the two daughter cells.

