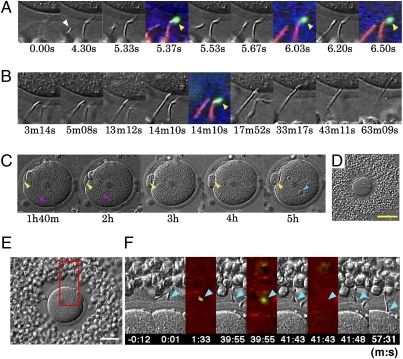
Fig. 3.
Viewing a fertilizing spermatozoon. (A–D) Photographs showing sperm penetration into the ZP and the cytoplasm of a single oocyte. Whether it was the actual fertilizing spermatozoon was determined retrospectively after video recording. Times are shown in seconds (s), minutes (m), and hours (h) after the fertilizing spermatozoon entered the field of view (0 s). (A) Successive stages of sperm attachment to the ZP. The fertilizing spermatozoon (arrowhead at 4.30 s) had no EGPF fluorescence (i.e., was acrosome reacted) before reaching the ZP surface at 6.20 s. (B) The head of this fertilizing spermatozoon passed through the ZP and reached the egg surface at 13 m 12 s. Note that an acrosome-intact spermatozoon (arrowhead at 14 m 10 s) with EGFP fluorescence remained on the ZP surface. (C) The oocyte under low magnification, showing formation of a second polar body (yellow arrowheads), sperm tail (red arrowheads), and sperm pronucleus (blue arrowhead). (D) The cumulus-enclosed oocyte before insemination under low magnification. (Scale bar, 100 μm.) (E and F) Fertilization by a spermatozoon that had undergone the AR after binding to the ZP. (E) A low-magnification view of a cumulus-enclosed oocyte used in this experiment. (Scale bar, 50 μm.) (F) The time of initial sperm binding to the ZP was set at 0. This spermatozoon remained on the ZP surface with an intact acrosome until 39 m 55 s and thereafter lost acrosomal EGFP by the time of the next fluorescence exposure at 41 m 43 s. After the AR, this spermatozoon initiated ZP penetration and fused with the plasma membrane of the oocyte at about 57 m 31 s. Arrowheads point to the sperm head.

