Abstract
Determining the factors that influence the distribution of woody vegetation cover and resolving the sensitivity of woody vegetation cover to shifts in environmental forcing are critical steps necessary to predict continental-scale responses of dryland ecosystems to climate change. We use a 6-year satellite data record of fractional woody vegetation cover and an 11-year daily precipitation record to investigate the climatological controls on woody vegetation cover across the African continent. We find that—as opposed to a relationship with only mean annual rainfall—the upper limit of fractional woody vegetation cover is strongly influenced by both the quantity and intensity of rainfall events. Using a set of statistics derived from the seasonal distribution of rainfall, we show that areas with similar seasonal rainfall totals have higher fractional woody cover if the local rainfall climatology consists of frequent, less intense precipitation events. Based on these observations, we develop a generalized response surface between rainfall climatology and maximum woody vegetation cover across the African continent. The normalized local gradient of this response surface is used as an estimator of ecosystem vegetation sensitivity to climatological variation. A comparison between predicted climate sensitivity patterns and observed shifts in both rainfall and vegetation during 2009 reveals both the importance of rainfall climatology in governing how ecosystems respond to interannual fluctuations in climate and the utility of our framework as a means to forecast continental-scale patterns of vegetation shifts in response to future climate change.
Keywords: quantile regression, intraannual variability, remote sensing, potential cover, ecohydrology
The direction and magnitude of ecosystem state shifts in response to altered patterns of regional precipitation is a global earth science research focus (1). Semiarid ecosystems are particularly susceptible to rapid structural changes due to the sensitive balance between vegetation structure, soils, and climates (2). The widespread distribution of semiarid ecosystems in Africa has made this continent a central focus of efforts to determine the principle factors that govern patterns of regional vegetation structure (3, 4).
In the arid and semiarid regions where savannas are commonly found, climate and vegetation are linked through the dynamics of soil moisture (5). Actual soil moisture levels are determined by the intensity and frequency of rainfall and runoff events, as well as evapotranspirive demands and leakage losses acting on the soil column (2). Currently, the availability of regional scale soil moisture data is limited in temporal and spatial availability, thus analysis of spatial patterns of rainfall statistics provide the best available means of assessing climatological impacts on ecosystem status. Numerous studies have demonstrated the effect of both annual rainfall totals (4–8) and interannual variability of rainfall (7–10) on vegetation structure. In contrast, the influence of intraannual rainfall climatology on the patterns of vegetation structure in dryland ecosystems has not been addressed. The analysis of steady-state statistical properties of regional precipitation regimes and associated ecosystem configuration provides a method to assess the climatological determents of woody cover in Africa.
The need to investigate the manner by which shifts in rainfall climatology affect ecosystem structure is highlighted by recent global (11) and regional (12) studies demonstrating localized shifts in rainfall frequency and intensity. Additionally, global climate models and climate theory predict intensification of precipitation extremes and changes in the hydraulic cycle in the 21st century as a result of global warming (13). Generally, these studies have shown a tendency toward more intense, less frequent rainfall events; however these shifts are not necessarily accompanied by substantiative changes in total rainfall amounts. Although a number of plot-scale experiments have examined vegetation sensitivity to both the timing (14, 15) and magnitude of rainfall events (16–18), these findings have not been generalized to larger scales.
Remote sensing of regional precipitation climatology and vegetation patterns presents an opportunity to advance from plot-scale studies to more broad biogeographical analysis of coupled climate and vegetation distributions (9). Satellite-derived rainfall measurements are currently available with more then 10 years of high resolution data (19). Furthermore, these data have been shown to preform well over regions of complex topography with limited ground-based measurement capability such as east Africa (20). Satellite-derived vegetation indices have previously been combined with both ground and satellite-based precipitation measurements to demonstrate strong correlations between monthly rainfall and vegetation phenology (10), gross primary production (21, 22), and vegetation cover fractions (23). However continental-scale assessments of the relationship between vegetation structure and rainfall climatology remain rare.
The focus of this manuscript is an investigation into the manner by which rainfall climatology determines the continental-scale distribution of woody cover in Africa. Specifically, we extend prior work on determinants of African woody vegetation structure by (i) characterizing the degree to which continental-scale patterns of rainfall climatology determine patterns of woody vegetation distribution; and (ii) inferring continental-scale sensitivity of ecosystem vegetation to future shifts in rainfall climatology derived from historical covariance of climate and vegetation. To achieve these goals, we utilize Tropical Rainfall and Measuring Mission (TRMM) rainfall data, which provides near global estimates of rainfall every 3 h at a quarter-degreespatial resolution from 1998 onward (19), and Moderate Resolution Imaging Spectroradiometer (MODIS) woody cover composites from 2000 through 2005 (24). These two products are used to assess the influence of wet season storm frequency and intensity on the distribution of woody cover across the African continent. Based on this analysis, we are able to identify regions particularly susceptible to shifts in rainfall climatology. Finally, we test our approach through a continental-scale analysis of ecosystem vegetation response to precipitation anomalies observed during 2009.
Results
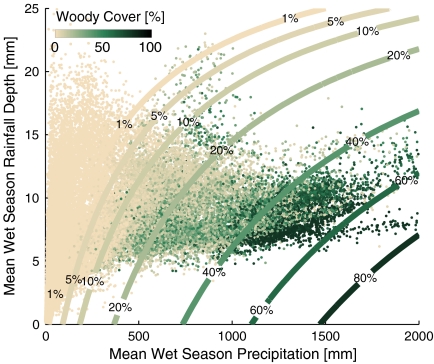
By combining TRMM-derived measures of average wet season precipitation, Pw [mm], and average wet season storm intensity, αw [mm] (see Materials and Methods for procedures used to estimate seasonal climate parameters) with MODIS-derived estimates of woody vegetation fractional cover, Fc, we are able to demonstrate the influence of precipitation climatology on patterns of African woody vegetation structure (Fig. 1). We find that the statistical manner by which precipitation arrives on a landscape is independent of the total rainfall quantity. For example, various combinations of average wet season lengths, rainfall intensities, and rainfall frequencies can result in similar total precipitation amounts across Africa. Additionally, regions with similar seasonal rainfall totals but different mean storm depths contain markedly different woody cover amounts. A least squares regression between Pw, αw, and Fc (Fig. 1, contours) provides a simple but robust statistical model (r2 = 0.65) of woody vegetation cover variation in response to varying rainfall climatologies.
Fig. 1.
Patterns of percent woody cover in response to TRMM-derived rainfall statistics for all locations in Africa. The MODIS woody cover data [%] (data points, n = 39,625) show a clear relationship to both mean wet season precipitation (Pw) levels and the mean depth of rainfall events during the wet season (αw). A least squares regression representing the woody vegetation fractional cover (contours) is fit to the data: Fc = 0.054Pw - 0.66αw - 0.0017Pwαw (r2 = 0.65).
Our results agree with prior studies that have identified climate as the key resource limiting woody cover across Africa (4, 6). However, these studies have also demonstrated that soil texture, nutrients, fire regime, herbivory, and land use contribute to local patterns of ecosystem structure. We hypothesize that the local maximum (or potential) woody cover is determined by rainfall climatology, as opposed to mean annual rainfall totals, and reductions in woody cover below this maximum are associated with secondary limitations such as those listed above. If water availability determines the maximum possible amount of tree cover, then we expect shifts in rainfall climatology will alter vegetation status. In this case, quantile regression techniques are utilized to assess the degree to which rainfall climatology governs patterns of potential woody cover. Analysis of the resulting potential woody cover envelope function allows for inferences to be drawn about the sensitivity of ecosystem states to shifts in the frequency and intensity of rainfall events.
Determination of Potential Woody Cover.
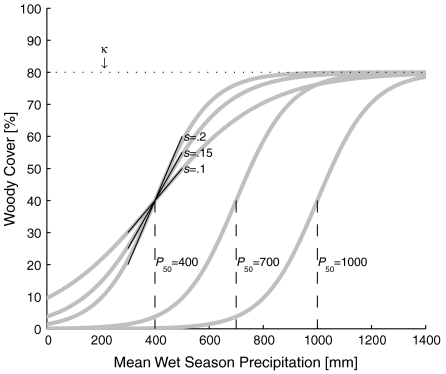
We identify the envelope functions that constrain woody cover across the African continent by determining the maximum values of woody cover found for specific rainfall climatologies. The shape of the envelope function is assumed to follow a logistic curve form. The logistic curve is a special case of the sigmoid curve that was found to best describe the relationship between African patterns of MODIS fractional tree cover and mean annual precipitation (6). This form provides a single function modeling three distinct regions: a treeless ecosystem with no woody cover, a savanna ecosystem with partial tree cover, and a fully forested ecosystem. As such, this curve is consistent with a general hypothesis that a minimum amount of moisture is necessary for woody vegetation to become established and that potential woody cover then increases asymptotically toward canopy closure at higher levels of water availability (6). Potential woody cover, Fpot, is uniquely determined as a function of Pw in conduction with constants s, P50, and κ (see Materials and Methods and Eq. 1). Larger values of the logistic slope, s, correspond to rapid increases in potential woody cover with rising seasonal precipitation, whereas larger values of the precipitation level at median canopy cover, P50, correspond to woody cover both becoming established and reaching full canopy closure, κ, at larger values of Pw (Fig. 2).
Fig. 2.
Examples of the generalized logistic curve used to represent potential woody cover, Fpot, as a function of mean wet season precipitation for different values of s and P50 in Eq. 1.
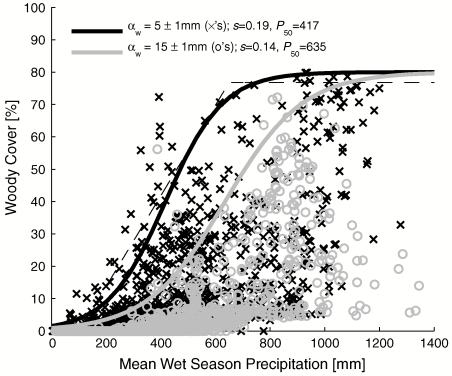
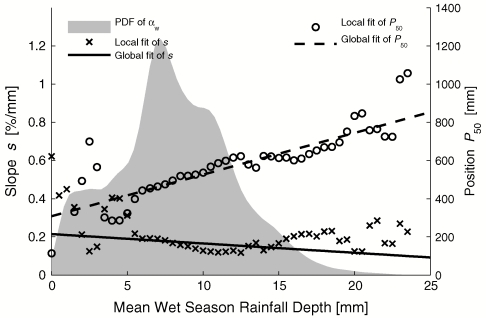
We quantify the extent to which rainfall climatology limits potential woody cover by determining how s and P50 vary across a range of observed mean storm depths, 0 mm ≤ αw ≤ 25 mm. Quantile regressions are used to determine the values of s and P50 that best describe the Fpot for all locations with similar values of αw. As an example, Fig. 3 shows the estimated Fpot for the data subsets corresponding to all locations in Africa with mean storm depths of αw = 5 ± 1 mm and αw = 15 ± 1 mm. A visual comparison of the two curves reveals that at the higher value of αw the envelope of potential woody cover that is less steep and laterally shifted toward higher total seasonal rainfalls. Indeed, across the entire distribution of commonly observed storm depths (Fig. 4, shaded area), we find that locations with larger mean storms depths require larger total rainfall amounts for woody vegetation to take root (greater P50’s; Fig. 4, ○ symbols) and exhibit more gradual increases (lower s’s; Fig. 4, × symbols) in woody cover with increases in seasonal precipitation totals. These shifts in Fpot agree with results from the prior section that found that more frequent, less intense storms lead to a higher fraction of woody cover for a given amount of total seasonal rainfall.
Fig. 3.
MODIS woody cover and TRMM precipitation data from African locations with mean wet season rainfall depth (αw) of 5 ± 1 mm (× symbols) and 15 ± 0.5 mm (○ symbols). Potential wood cover curves (solid lines) represents the effect of water limitation on woody vegetation growth at locations with different climatology. The 99th quantile piecewise linear regression of potential tree cover as a function of Py from Sankaran et al. (4) is also shown (dashed line).
Fig. 4.
Local and global fitting of potential woody cover curve parameters s, P50 and c1–4. Local regression points ( × or s, ○ for P50) are the result of quantile regression fitting of a slope s and position P50 preformed on the subset of Fc and Pw data points when αw is within 1 mm of horizontal axis value. Straight lines (solid for s, dashed for P50) are the result of global quantile regression of logistic curve parameters c1–4 using entire data set. Shaded area represents kernel density estimation of the probability density function of αw.
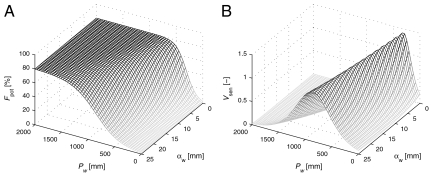
The trends in the potential woody cover parameters suggest that s and P50 are themselves functions of the rainfall climatology (αw). We describe this relationship using two linear equations (see Materials and Methods) and conduct a global quantile regression to determine the potential woody cover envelope for all of the rainfall climatologies observed on the African continent. We find that P50 will begin at 308 mm and increase at 21.8 mm per mm increase in αw, whereas s will begin at 0.21%/mm and decrease at a rate of 0.005%/mm per mm increase in αw (Fig. 4). The global quantile regression creates a generalized response surface (Fig. 5A) representing potential woody vegetation cover as determined by both seasonal rainfall totals and mean seasonal storm depths. This response surface demonstrates how intraannual rainfall statistics alter the patterns of water availability that determine limits of African woody vegetation structure.
Fig. 5.
Estimated potential woody vegetation cover and vegetation sensitivity to climate. The surface (A) representing the 99th quantile of woody vegetation cover (Fpot) as a function of mean wet season precipitation (Pw) and mean rainfall depth during the wet season [αw (mm)]. The local slope of the 99th quantile surface is calculated along both axes, normalized, then combined to form an index (B) of vegetation sensitivity to climate fluctuations (Vsen).
Ecosystem Sensitivity to Rainfall Climatology.
Our results demonstrate that spatial patterns of potential woody cover across Africa are primarily driven by the spatial statistics of rainfall arrival patterns. We argue that fluctuations in these same climatological parameters are also key determinates of temporal patterns in ecosystem vegetation status as a whole, influencing both woody and herbaceous biomass. Given this hypothesis, we expect that the response surface of vegetation to temporal fluctuations in rainfall climatology will be of similar form as Fig. 5A. Therefore the degree to which ecosystem vegetation state is altered by changes in Pw or αw values is determined by the rate of change in this response surface with respect to changes in climate parameters calculated in the direction of rainfall pattern shifts (i.e. the local slope of Fpot in Fig. 5A). This local slope, calculated with Eq. 6 of methods, is a measure of the sensitivity of a location to climatological fluctuations, with regions of steep local slopes being highly sensitive to small shifts in climate. To assess continental-scale patterns of vegetation sensitivity to shifts in rainfall, we define the normalized local gradient of the response surface as a sensitivity index for ecosystem vegetation, Vsen (Fig. 5B).
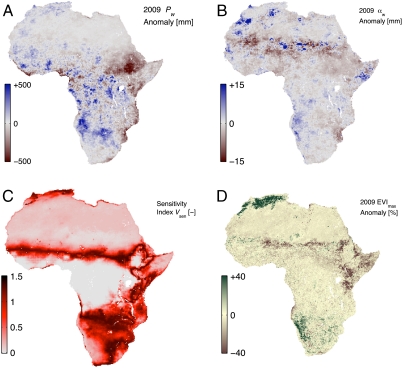
Analysis of 2009 TRMM climate statistics compared with those of the previous decade shows large anomalies of Pw in east Africa (Fig. 6A) as well as anomalies of αw in the Sahel region (Fig. 6B). Both of these large anomalies occur without significant changes to the other climate parameter, indicating substantial, independent shifts in the statistics of intraannual rainfall. An index, ΔCL, is created as the geometric mean of the Pw and αw percent anomalies for 2009 and provides a simple measure of rainfall climatology fluctuation that includes changes in both rainfall totals and rainfall arrival patterns This climate index and the geographic distribution of the vegetation sensitivity index Vsen (Fig. 6C) are used to assess the impact of shifts in rainfall patterns on vegetation during 2009.
Fig. 6.
Maps of African 2009 climate anomalies, vegetation sensitivity, and vegetation anomalies. Difference between 2009 and the average climate of the period from 1998 through 2008 for wet season rainfall totals (A) and average wet season rainfall depth (B). The vegetation sensitivity index Vsen (C) derived from the normalized gradient of Fpot is mapped for Africa, with darker area representing sensitive regions. Climate anomalies and climate sensitivity combine to influence 2009 vegetation as measured by the percent change in 2009 MODIS EVI [%] from the average EVI values during 2000–2008 (D).
Both the distribution of short-term rainfall climate anomalies observed in 2009 (ΔCL) and the sensitivity index derived from longer climate records (Vsen), contribute to the 2009 vegetation dynamics across Africa. We assess the response of vegetation to the 2009 rainfall anomalies using the MODIS Enhanced Vegetation Index (EVI) (25) product. MODIS EVI is more responsive to ecosystem structural variations and canopy architecture than chlorophyll-sensitive normalized difference vegetation index products (25). Because EVI is sensitive to leaf phenology we take the yearly maximum EVI value as a surrogate for ecosystem vegetation status, which is validated by the high correlation (Pearson’s ρ = 0.56) between woody cover and EVImax for 2000–2005. MODIS EVI data from the year 2009 are compared to EVI data from the years 2000–2008 to measure anomalies in the vegetation response to climate fluctuations, ΔEVI (Fig. 6D). Large vegetation anomalies are observed in the Atlas mountains of Morocco and Algeria, along the Sahel region, in East Africa (Kenya and Tanzania), and along the coast of Namibia. These areas of large ΔEVI correspond to locations of high Vsen. Over the entire continent, anomalies in 2009 vegetation show a larger correlation to Vsen (Pearson’s ρ = 0.14) than either anomalies in Pw (ρ = -0.016) or anomalies in αw (ρ = -0.00072) alone.
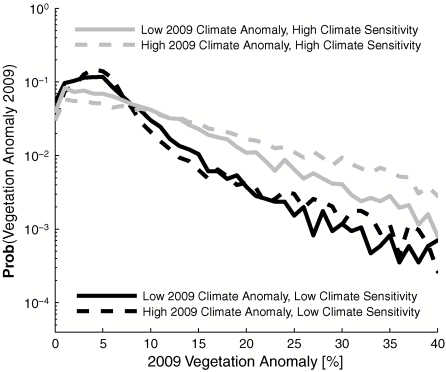
Whereas we find that inclusion of both Pw and αw variations are needed to understand 2009 EVI changes, we also note that the vegetation anomalies of 2009 of cannot be solely explained by large anomalies in 2009 rainfall patterns. For example, changes in seasonal rainfall totals in the Ethiopian highlands during 2009 did not result in high ΔEVI values, while areas in the Atlas mountains experienced high ΔEVI values without large changes in either PW or αw in 2009. In general most 2009 EVI anomalies are observed to occur in areas that experienced large climate anomalies and have high climate sensitivity. In contrast, areas with lower predicted climate sensitivity experienced low vegetation anomalies even if climate fluctuations were high. Furthermore, by classifying Africa into four groups (low and high Vsen and low and high ΔCL) we show that both long-term climate sensitivity and short-term climatic anomalies shape the distribution of the probabilities of African vegetation anomalies (Fig. 7). Regions that did not experience vegetation anomalies (ΔEVI < 8%) are most likely to have a low Vsen whereas areas that experienced larger vegetation anomalies are more likely to be regions of high climatic sensitivity.
Fig. 7.
Probability of vegetation anomalies in Africa during 2009 for locations with high or low fluctuations of climate (ΔCL) in 2009 and locations with high or low sensitivity to climate fluctuations (Vsen). The median values of ΔCL and Vsen are used to divide all African locations for 2009 into these four groups.
Discussion
Our analysis assumes that the seasonal rainfall climatology parameters developed from the TRMM data are appropriate measures of plant water availability. By conducting this analysis over the entire continent of Africa we hope to achieve a robust sampling of possible climate and vegetation configurations thereby mitigating possible sensor errors in the TRMM and MODIS products. Because the length of the wet season Tw is assumed to be inversely related to the derived seasonality index SI we are not able to explicitly consider bimodal distributions of annual rainfall, which are common in equatorial regions. Despite this omission, our calculations show that across Africa an average of 79% of the yearly rainfall arrives in the identified wet season, with average wet season length of 172 d, thus capturing the majority wet season events across the continental variation of climates. Furthermore, we do not find that the predictive power of our relationship is substantially reduced in equatorial regions relative to subtropical zones.
Although our prediction of African woody cover patterns only utilizes two independent measures of rainfall climatology, it nevertheless approaches the same predictive power of prior continental-scale analyses (r2 = 0.65) that considered a full suite of possible woody cover determinants including soil nitrogen, fire frequency, cultivation intensity, human population, and cattle density (6). Furthermore, we find that the inclusion of both seasonal rainfall totals and seasonal rainfall intensity as depicted in Fig. 1 provides a significant improvement over a simple linear regression analysis using only yearly rainfall totals (r2 = 0.57) or only yearly storm depths (r2 = 0.09).
Over the range of commonly observed αw values the global quantile regression shows good agreement with the local quantile regression, with both forming a linear trend. Outside this range the limited number of data points within the search bandwidth of αw ± 1 mm decrease the ability of the local quantile regression search algorithm to converge to stable values. It has been theorized (11) that very dry regions may respond differently then semiarid and temperate locations to shifts in intraannual rainfall and further analysis with more robust data may yield a more intricate relationship between potential woody cover and rainfall statistics. Additionally, the lower bounds on detection of small rainfall events by remote sensing techniques may have lead to the lack of stable convergence of the quantile regression at low αw values. As αw approaches zero, full canopy closure occurs at the smallest Pw and largest αw values, forming the envelope function most likely to pass above the largest number of MODIS data points. This curve is of similar form as the piecewise upper bound of tree cover found by Sankaran et al. (4) (Fig. 3, dashed line), whose quantile regression analysis did not consider the effect of storm depths on woody cover.
The vegetation sensitivity index Vsen is derived as a metric to assess the entire ecosystem response to climatological perturbations. These perturbations in seasonal rainfall totals and storm intensities are assessed for 2009 for the continent of Africa. Only in extremely dry locations such as the Sahara Desert does the assessment of seasonal rainfall parameters from 1 year of data becomes less meaningful as rainfall may arrive in one or two events leading to a very short season with high storm depths. The observed rainfall anomalies, in conjunction with the vegetation sensitivity index derived from long-term climate and woody cover patterns, assist in prediction of short-term consequences of climatic anomalies on ecosystem. We do not argue that this short-term response is dominated by shifts in woody cover, but instead is most likely due to a combination of shifts in both woody vegetation phenology and herbaceous biomass. The fact that regions predicted to have higher sensitivity to climate fluctuations exhibited larger responses to rainfall climatology anomalies during 2009 (Fig. 7) demonstrates the utility of considering rainfall climatology anomalies as a determinant of temporal vegetation dynamics. Moreover, our results strongly suggest that both long-term spatial patterns of potential woody cover and short-term temporal dynamics of vegetation are strongly controlled by the frequency and depth of storms rather than simply the total amount of annual rainfall.
Conclusion
The results of this study clearly indicate that the frequency and intensity of precipitation events are important determinants of terrestrial ecosystem state and must be considered when addressing water limitation in semiarid ecosystems. Though the idea that vegetation properties are influenced by patterns of rainfall frequency and intensity are not completely new, previous work has been limited to theoretical predictions (e.g., ref. 11) and small plot-scale studies of specific ecosystems (e.g., ref. 16). With the use of MODIS and TRMM data we derive continental-scale distributions of the climate parameters Pw and αw and demonstrate that across Africa more frequent yet less intense rainfall events lead to decreased woody cover. The estimation of the envelope of potential woody cover allows for quantification of the consequences of water limitation in regions where multiple human and environmental factors influence ecosystem state. Finally, we derived a simple index of vegetation sensitive to climate fluctuation, which enables identification of regions likely to respond strongly to possible climate change. This index proves a useful resource in the explanation of vegetation anomalies as a result of the 2009 Africa droughts and forecasts regional consequences for terrestrial ecosystems to shifts in rainfall patterns as a result of future climate change.
Materials and Methods
Data Collection.
The TRMM-4B32 (19) product is available in 3 h, 0.25° resolution files, which we use to assess mean climatological parameters (1998–2008) and climate anomalies (2009). The MODIS-44B (24) Vegetation Continuous Field files are yearly composites of woody cover estimates, of which all available files (2000–2005) are averaged to estimate woody cover. The MODIS-13C1 (25) Enhanced Vegetation Index is available at 16-d, 0.05° resolution, and are used to assess mean vegetation status (2000–2008) and vegetation anomalies (2009). We use the MODIS Reproduction Tool (US Geological Survey 2008, version 4.0) to regrid the original sinusoidal MODIS data into a geographic projection with a nearest neighbor sampling scheme. All analysis is conducted at a 0.25° over the African continent.
Statistical Analysis of Continental-Scale Rainfall Patterns.
The total annual precipitation, Py[mm], at a location is uniquely defined by the average rainfall depth, αy[mm], the average frequency of rainfall days, λy[1/d], and the year length, Ty[d], such that Py = αyλyTy. Furthermore, the values of Py and Ty, in conjunction with the total number of rainfall days in a year, ηy [-], provide enough information for estimation of both αy and λy, according to αy = Py/ηy and λy = ηy/Ty. Because rainfall patterns throughout the tropics are strongly seasonal (26), annualized climatological parameters (αy and λy) may not yield a representative parameterization of rainfall conditions during the period of active plant growth. Along a transect from the Sahel south into central Africa, the wet season varies in length from two to twelve months with the month of maximum rainfall also dependent on location (26). Consideration of growing season—as opposed to yearly—precipitation statistics is more appropriate as these patterns should have the largest direct impact on ecological processes (11). The equations used to calculate P, α and λ take the same form when analysis is conducted over the active growing season (Pw, αw, λw and Tw), which we determine using the seasonality index SI and wet season peak θSI.
Climate Seasonality Estimation.
The wet season is assed using circular statistics following Markam (27). Daily rainfall records created from the sum of 3 h MODIS data are translated to vectors, with the vector magnitude corresponding to daily rainfall amounts and vector direction corresponding to the day of year. The direction of the vector created from the sum of daily vectors, describes the day of year upon which rain is most likely to occur and this day is taken to be the center of the wet season θSI. The magnitude of the resultant vector describes the degree to which rainfall arrives near the center of the wet season. The ratio of the resultant vector length to the total annual precipitation is defined the seasonality index SI. The length of the wet season is assumed to be inversely related to the value of SI as Tw = Ty(1 - SI) and centered around Julian day θSI. All days within the designated average growing season are then used to calculate the average daily rainfall αw and average rate of occurrence of rainfall days λw during the wet season.
Determination of Potential Woody Cover.
We define potential woody cover, Fpot, as the envelope function passing above 99% of a set of woody cover data points. Fpot is determined as a function of the Pw as
 |
[1] |
where P50[mm] is the wet season precipitation value such that the potential woody cover is half of the carrying capacity, and s [%/mm] is the slope of the asymptotic curve at the point when Pw is equal to P50 (Fig. 2). We set the carrying capacity κ at a value of 80%, which is the maximum value returned by the MODIS-MOD44B algorithm. The linear functions describing the relationship between variables s, P50 and αw are specified as:
| [2] |
and
| [3] |
where c1, c2, c3, and c4 are constants. Combining Eqs. 2 and [3] with [1], we use quantile regression to find the four coefficients (c1–4) as 308, 21.8, 0.21, and 0.005 respectively.
Regression Analysis.
The least squares and local and global quantile regressions are conducted in the MATLAB programing environment (The MathWorks Inc., version R2010a). To determine Fpot, individual quantile regressions are performed on all TRMM and MODIS data points within a search window of ± 1 mm of the current αw value, where αw is incremented in 0.5mm intervals from 0 to 25 mm. The simplex search methods is used to maximize the value of R (analogous to the r2 of least squares regression) by varying the coefficients s, and P50, or c1–4. The R value is defined as
 |
[4] |
where τ is the quantile at which the calculation is preformed, and yi are the response variable (28). The value of  is the sample τth quantile of the yi values, and the
  values are the model results. The ρ(·) function is defined as
 |
[5] |
for any value of x (29). The global fitting was conducted with all points, whereas local fits were conducted on subsets within ± 1 mm of the αw value.
Calculation of the Climatology Sensitive Index.
To assess continental-scale patterns of vegetation sensitivity to shifts in rainfall, we define the normalized local gradient of the response surface Vsen as
 |
[6] |
with normalization being taken along each axis individually to account for the different scales (0–25 mm vs. 0–2000 mm) along each axis.
Acknowledgments.
This work was supported by the National Science Foundation through Grants DEB-742933 and EAR-0847368.
Footnotes
The authors declare no conflict of interest.
*This Direct Submission article had a prearranged editor.
References
- 1.Weltzin JF, et al. Assessing the response of terrestrial ecosystems to potential changes in precipitation. Bioscience. 2003;53:941–952. [Google Scholar]
- 2.Rodriguez-Iturbe I, D’Odorico P, Porporato A, Ridolfi I. On the spatial and temporal links between vegetation, climate and soil mositure. Water Resour Res. 1999;35:3709–3722. [Google Scholar]
- 3.Scholes RJ, Archer SR. Tree-grass interactions in savanna. Annu Rev Ecol Syst. 1997;28:517–544. [Google Scholar]
- 4.Sankaran M, et al. Determinates of wood cover in african savannas. Nature. 2005;438:846–849. doi: 10.1038/nature04070. [DOI] [PubMed] [Google Scholar]
- 5.Noy-Meir I. Desert ecosystems: Environment and producers. Annu Rev Ecol Syst. 1973;4:25–51. [Google Scholar]
- 6.Bucini G, Hanan NP. A continental-scale analysis of tree cover in african savannas. Global Ecol Biogeogr. 2007;16:593–605. [Google Scholar]
- 7.Camberlin P, Martiny N, Philippon N, Richard Y. Determinants of the interannual relationships between remote sensed photosynthetic activity and rainfall in tropical africa. Remote Sens Environ. 2007;106:199–216. [Google Scholar]
- 8.Willimas CA, et al. Interannual variability of photosynthesis across africa and its attribution. J Geophys Res. 2008;113:G04015. [Google Scholar]
- 9.Lotsch A, Friedl MA, Anderson BT, Tucker CJ. Coupled vegetation-precipitation variability observed from satellite and climate records. Geophys Res Lett. 2003;30:1774–1777. [Google Scholar]
- 10.Zhang X, Friedl MA, Schaaf CB, Strahler AH, Liu Z. Monitoring the response of vegetation phenology to precipitation in Africa by coupling modis and trmm instruments. J Geophys Res. 2005;110:D12103. [Google Scholar]
- 11.Knapp AK, et al. Consequences of more extreme precipitation regimes for terrestrial ecosystems. Bioscience. 2008;58:811–821. [Google Scholar]
- 12.Franz TE, Caylor KK, Nordbotten JM, Rodriguez-Iturbe I, Celia MA. An ecohydrological approach to predicting regional woody species distribution patterns in dryland ecosystems. Adv Water Resour. 2010;33:215–230. [Google Scholar]
- 13.O’Gorman PA, Schnider T. The physical basis for increases in precipitation extremes in simulations of 21st-century climate change. Proc Natl Acad Sci USA. 2009;106:14773–14777. doi: 10.1073/pnas.0907610106. [DOI] [PMC free article] [PubMed] [Google Scholar]
- 14.Bates JD, Svejcar T, Miller RF, Angell RA. The effects of precipitation timing on sagebrush steppe vegetation. J Arid Environ. 2006;64:670–697. [Google Scholar]
- 15.Fay PA, Carlisle JD, Knapp AK, Blair JM, Collins SL. Altering rainfall timing and quantity in a mesic grassland ecosystem: Design and performance of rainfall manipulation shelters. Ecosystems. 2000;3:308–319. [Google Scholar]
- 16.Heisler-White JL, Blair JM, Kelly EF, Harmoney K, Knapp AK. Contingent productivity responses to more extreme rainfall regimes across a grassland biome. Glob Change Biol. 2009;15:2894–2904. [Google Scholar]
- 17.Robertson TR, Bell CW, Zak JC, Tissue DT. Precipitation timing and magnitude differentially affect aboveground annual net primary productivity in three perennial species in a chihuahuan desert grassland. New Phytol. 2008;181:230–242. doi: 10.1111/j.1469-8137.2008.02643.x. [DOI] [PubMed] [Google Scholar]
- 18.Wang L, D’Odorico P, Manzoni S, Porporato A, Macko S. Soil carbon and nitrogen dynamics in southern african savannas: The effect of vegetation-induced patch-scale heterogeneities and large scale rainfall gradients. Climatic Change. 2009;94:63–76. [Google Scholar]
- 19.Huffman GJ, et al. The trmm multisatellite precipitation analysis (tmpa): Quasi-global, multiyear, combined-sensor precipitation estimates at fine scales. J Hydrometeorol. 2007;8:38–55. [Google Scholar]
- 20.Dinku T, et al. Validation of satellite rainfall products over east Africa’s complex topography. Int J Remote Sens. 2007;28:1503–1526. [Google Scholar]
- 21.Zhao M, Running SW. Drought-induced reduction in global terrestrial net primary production from 2000 through 2009. Science. 2010;329:940–943. doi: 10.1126/science.1192666. [DOI] [PubMed] [Google Scholar]
- 22.Brando PM, et al. Seasonal and interannual variability of climate and vegetation indices across the Amazon. Proc Natl Acad Sci USA. 2010;107:14685–14690. doi: 10.1073/pnas.0908741107. [DOI] [PMC free article] [PubMed] [Google Scholar]
- 23.Scanlon TM, Albertson JD, Caylor KK, Williams CA. Determining land surface fractional cover from ndvi and rainfall time series for a savanna ecosystem. Remote Sens Environ. 2002;82:376–388. [Google Scholar]
- 24.DeFries RS, Hansen MC, Townshend JRG, Janetos AC, Loveland TR. A new global 1-km dataset of percentage tree cover derived from remote sensing. Glob Change Biol. 2000;6:247–254. [Google Scholar]
- 25.Huete A, et al. Overview of the radiometric and biophysical performance of the modis vegetation indices. Rem Sens Environ. 2002;83:195–213. [Google Scholar]
- 26.Nicholson SE. The nature of rainfall variability over africa on time scales of decades to millenia. Global Planet Change. 2000;26:137–158. [Google Scholar]
- 27.Markham CG. Seasonality of precipitation in the United States. Ann Assoc Am Geogr. 1970;60:593–597. [Google Scholar]
- 28.Hao L, Naiman DQ. Quantile Regression. Thousand Oaks, CA: SAGE; 2007. [Google Scholar]
- 29.Koenker R. Quantile Regression. Cambridge, UK: Cambridge University Press; 2005. [Google Scholar]


