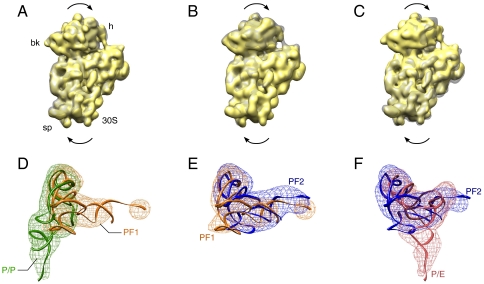
Fig. 2.
Comparison of the different states of theG2252C PRE complex. (Upper) Superimposition of the density maps of the 30S subunit, depicting the rotation of the 30S. (Lower) Superimposition of the density maps of the P-site tRNA, depicting the conformational change of the P-site tRNA. (A) and (D) Comparison between the nonrotated structure (NRS) and intermediate rotated structure 1 (IRS1). (B) and (E) Comparison between the intermediate rotated structure 1 (IRS1) and the intermediate rotated structure 2 (IRS2). (C) and (F) Comparison between the intermediate rotated structure 2 (IRS2) and the rotated structure (RS).

