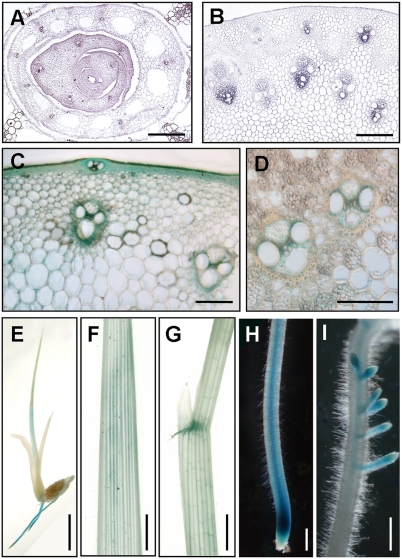
Fig. 4.
OsNST1 expression analysis. (A and B) RNA in situ hybridization of the leaf sheaths (A) and young stems (B). (Scale bars, 70 μm.) (C and D) GUS staining of the culms of 3-mo-old T0 transgenic plants. (Scale bars, 60 μm.) (E–I) GUS staining of 10-d-old T1 transgenic seedlings, showing GUS signals in a whole seedling (E), a leaf (F), a leaf lamina (G), and veins of primary and lateral roots (H and I). (Scale bars, 2 mm.)

