Fig. 6.
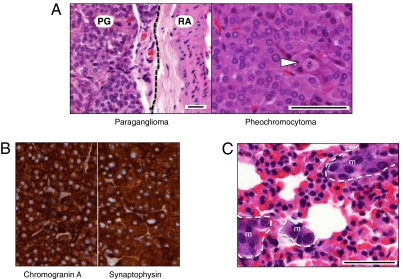
B-Raf+/LSLV600E mice develop chromaffin cell tumors. (A Left) H&E staining of a representative paraganglioma (PG) located adjacent to the renal artery (RA). Dotted line serves to separate both structures. (A Right) A pheochromocytoma depicting a mitotic figure (arrowhead). (B) Immunohistochemical staining for chromogranin A and synaptophysin of a representative pheochromocytoma. (C) H&E staining of micrometastases (m) detected in the lung of a pheochromocytoma-bearing mouse. Note the difference in nuclear and cellular size between normal lung parenchyma and a group of cells forming micrometastases. (Scale bars, 50 μm.)

