
Figure 1.
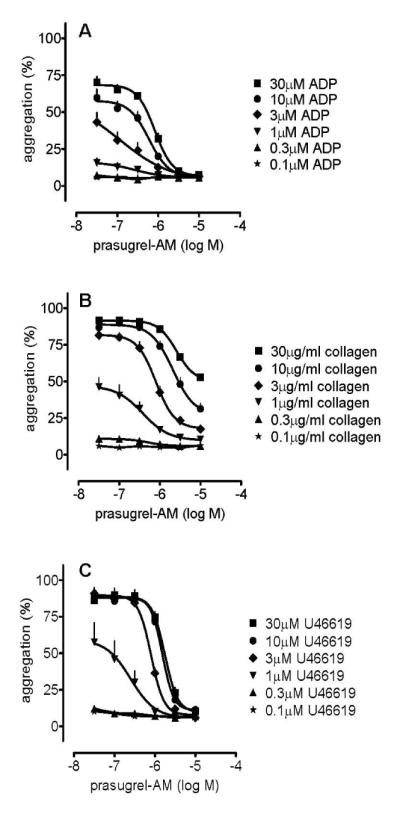
Platelet aggregations induced by ADP (0.1-30 μmol L−1; panel A), collagen (0.1-30 μg mL−1; panel B), or U46619 (0.1-30 μmol L−1; panel C) were inhibited in a concentration-dependent manner by PAM (p<0.05 for all; two way ANOVA). Curves for 0.1 μmol L−1 and 0.3 μmol L−1 ADP are superimposed upon one another (panel A), as are curves for 0.1 μmol L−1 and 0.3 μmol L−1 U46619 (panel B). Data shown are mean ± s.e.m. of responses measured by 96-well plate aggregometry in citrated PRP prepared from 6 different individuals.