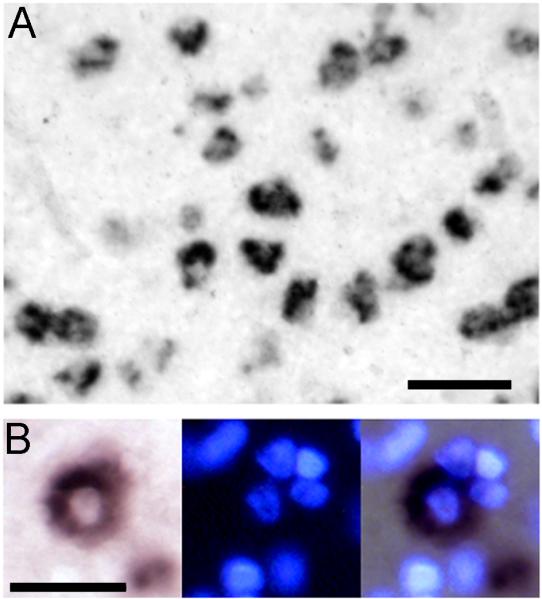
Figure 1.

A. zRalDH-positive cells in HVC show distinct cellular labeling; scale bar = 0.05 mm. B. Detail views of cellular labeling pattern under brightfield (left), UV illumination (center) and merged image. At the center of the field is a zRalDH-positive cell with characteristic cytoplasmic distribution of labeling and a clear central zone; the nuclei of the labeled cell and of neighboring -negative cells are readily identifiable by Hoechst staining; scale bar = 0.025 mm.
