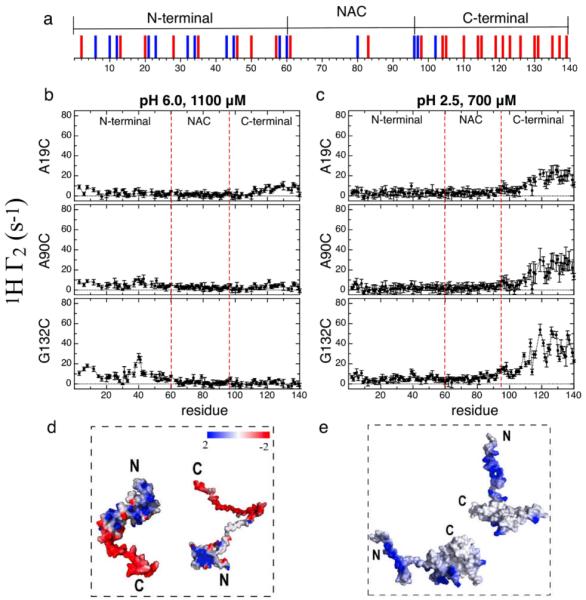
Figure 1.

Transient encounter complexes in the intrinsically disordered protein αSyn. The distribution of positively and negatively charged residues is shown with blue and red bars respectively (a). Inter-chain NMR PRE profiles for intrinsically disordered αSyn at pH 6.0 (b) and pH 2.5 (c). 1H Γ2 values with MTSL labels at A19C, A90C and G132C are shown for both sets of conditions. Models that illustrate the inter-chain interactions observed from the PRE experiments at neutral (d) and low pH (e). Monomer conformations were selected from the REMD ensemble generated at neutral and low pH in ref. 5b and are shown as electrostatic surface potentials. The surface potential was calculated by Delphi7 and the color gradient from red to blue indicates surface potential from −2 to 2 kT/e.
