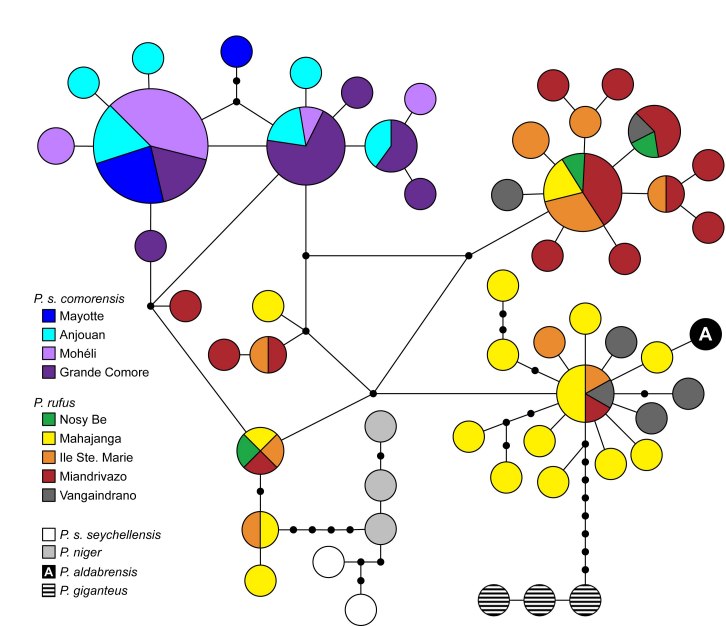
Figure 4. Haplotype network of individuals from multiple localities for Pteropus rufus and P. s. comorensis, as well as individuals from P. s. seychellensis, P. aldabrensis, P. giganteus, and P. niger. The size of the circle indicates the number of individuals with that haplotype with the frequency of each haplotype across multiple localities indicated with pie charts.

An official website of the United States government
Here's how you know
Official websites use .gov
A
.gov website belongs to an official
government organization in the United States.
Secure .gov websites use HTTPS
A lock (
) or https:// means you've safely
connected to the .gov website. Share sensitive
information only on official, secure websites.
