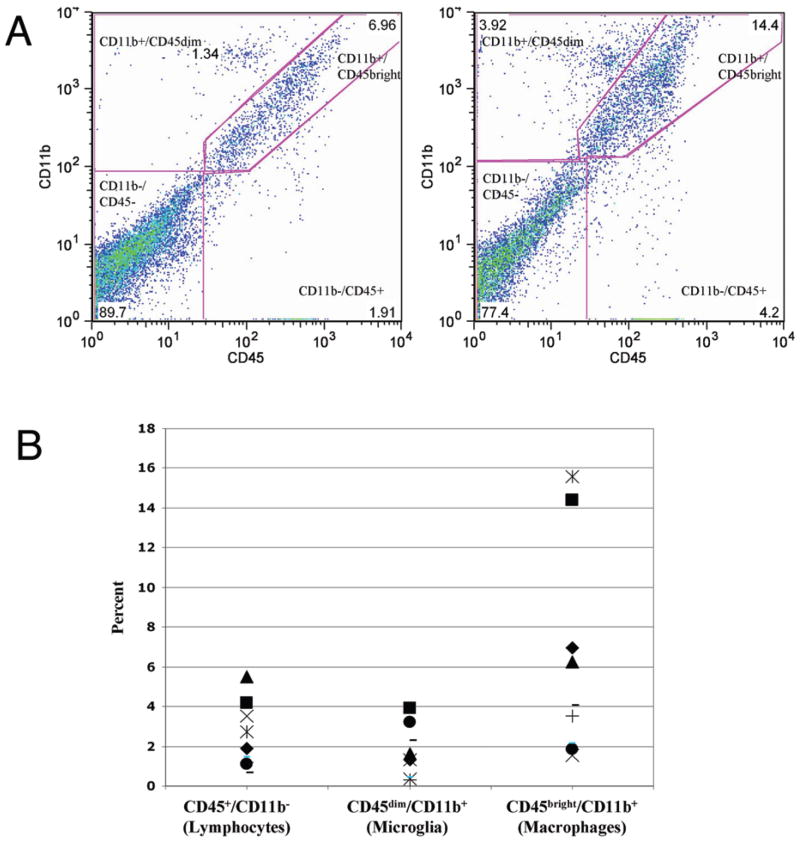
Fig. 2.
A: Two representative dot plots showing CD45 and CD11b staining for enhancing GBM specimens by flow cytometry. Each dot represents a single stained cell. Four distinct populations can be seen: CD45−/CD11b−, CD45+/CD11b−, CD45dim/CD11b+, and CD45bright/CD11b+. Double negative gates are based on isotype-matched controls (not shown). B: Summary scatter plot showing the percentage of total viable cells that were CD45+/CD11b−, CD45dim/CD11b+, and CD45bright/CD11b+. Each shape represents a tumor specimen taken from a specific patient.

