Fig. 5.
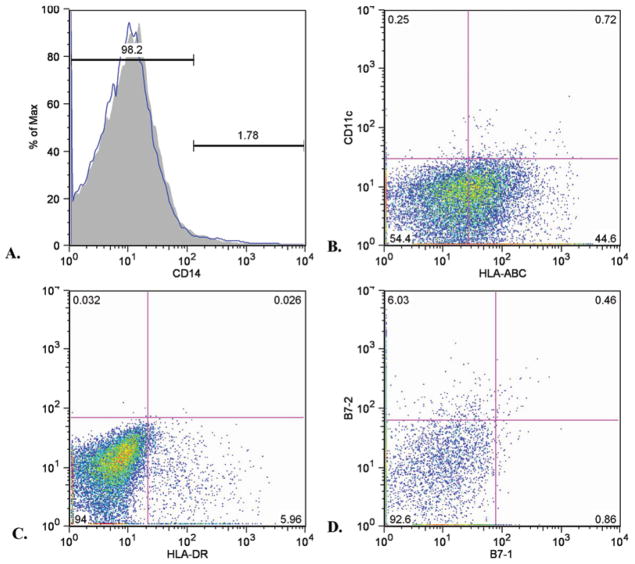
Representative flow cytometry histogram (A) and dot plots (B–D) of more detailed immunomarker profiles of single-cell suspensions of fresh glioma specimens performed in a subset of patients. Expression of CD14 (A, essentially absent on all cells). Class I MHC (HLA-ABC) and CD11c expression (B). Note a biphasic Class I MHC expression (mostly moderately positive with a strongly positive subset) and limited CD11c expression. Class II MHC (HLA-DR) expression (C); a subset of cells is positive. Expression of B7-1 and B7-2 (D). Expression of the former is very limited, but B7-2 expression is seen as a subset of cells. Note that the percentage of Class I MHChigh, Class II MHC+, and B7-2+ cells roughly corresponds numerically to the number of CD45bright/CD11b+ cells for this sample (6.24%, data not shown)

