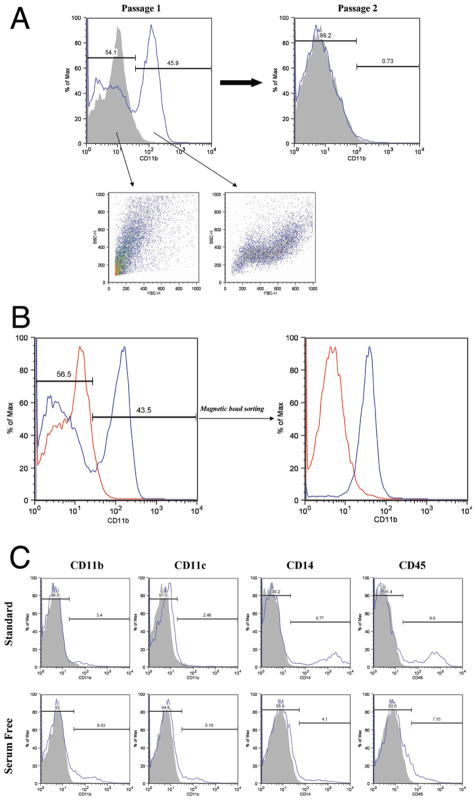
Fig. 6.
A: Histogram (Passage 1) showing CD11b expression in a primary human glioma culture. Distinct CD11b− and CD11b+ populations can be seen that have distinct forward scatter (FSC) and side scatter (SSC) properties. Note that the CD11b+ population is lost by Passage 2. B: Histograms showing purification of CD11b+ cells from glioma primary culture by sorting with anti–CD11b-coated microbeads. C: Histograms showing percentage of inflammatory cell marker-positive cells seen in primary glioma cultures established from a single specimen in the presence or absence of serum.

