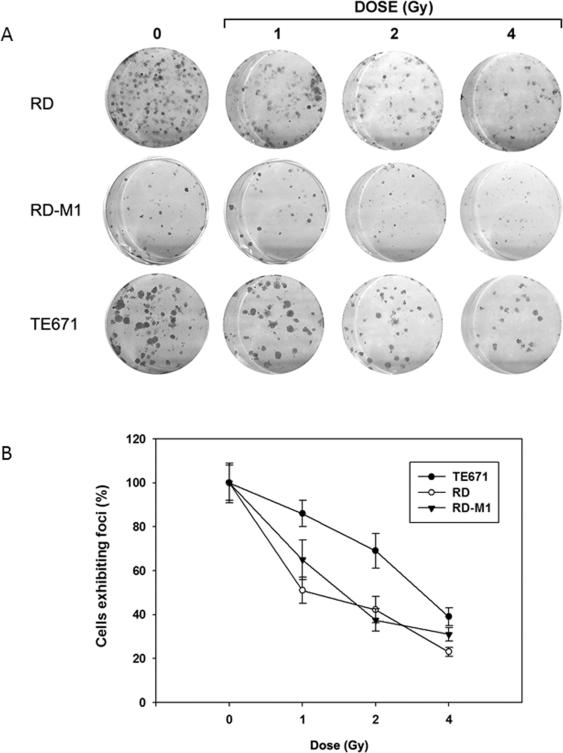
Figure 1.
Clonogenic assay of embryonal rhabdomyosarcoma cell lines, RD, RD-M1 and TE671 at different Gy doses. A) picture of cristal violet stained cultures 15 days after irradiation at indicated doses (1, 2, 4 Gy); B) dose-dependent colonies formation, each point of the three curve is the average ± SEM of three samples. Similar results were obtained in three experiments.

