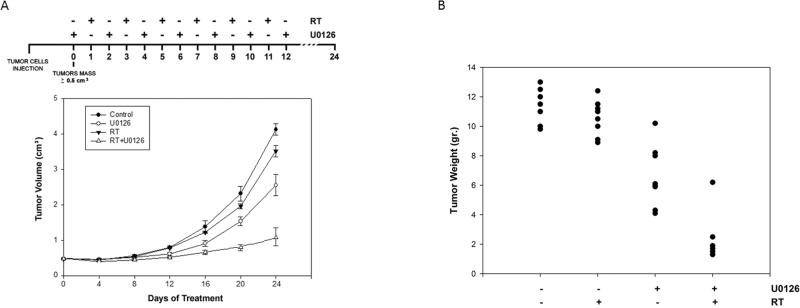
Figure 4.
(A) Growth curve of tumors volumes from xenografted TE671 cell lines, untreated ( ), U0126-treated (
 ), irradiated (RT ▼-▼), U0126-pretreated and irradiated (RT+U Δ-Δ). Tumor volumes were evaluated as describes in methods and represent the mean ±.SEM of 8 mice. The upper panel shows the sequential treatments of xenografted mice started when tumor reached a volume of approximate 0,5 cm3. U0126 was administered 1 day before each irradiation. (B) Tumor weights in mice untreated or treated with U0126, radiotherapy or combined treatment.

