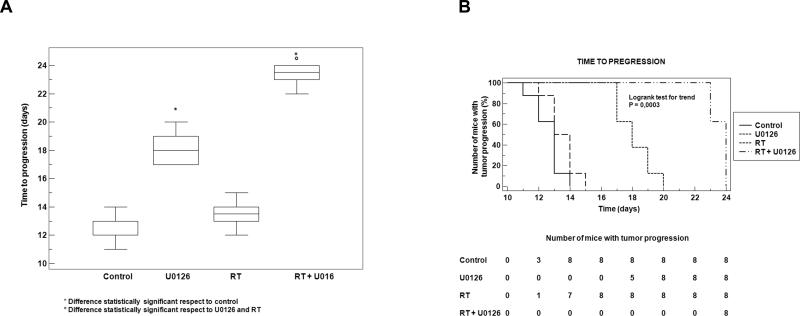
Figure 5.
(A) U0126 with RT combined treatment affects time to progression in vivo xenografted tumors. (B) Box plot diagram comparing median time (days) of tumor progression (TTP) among treatment groups. Box represents interquartile range (IQR), bar median value and whiskers represent data points within IQR.

