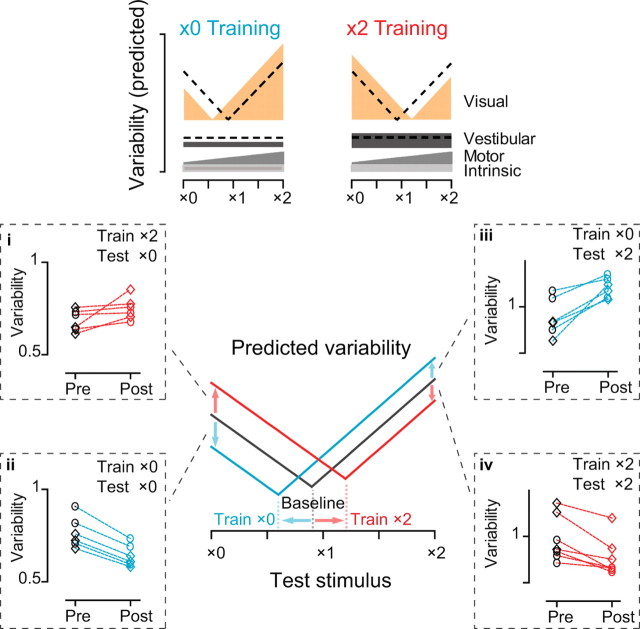
Figure 5.
Effect of training on the variability of eye movement responses to a range of 0.5 Hz visual–vestibular stimuli. Top, Predicted effect of ×0 training (left) and ×2 training (right) on the different sources of eye movement variability for a range of visual–vestibular stimuli (×0 to ×2). Dashed lines represent the baseline, pretraining variability. The lowest point of each curve reflects the VOR gain. Bottom, Predicted (center) and measured (dashed boxes) variability of eye movements pretraining (black), post-×0 training (cyan) and post-×2 training (red). The training and testing stimuli are indicted in the upper right corner of each dashed box.

