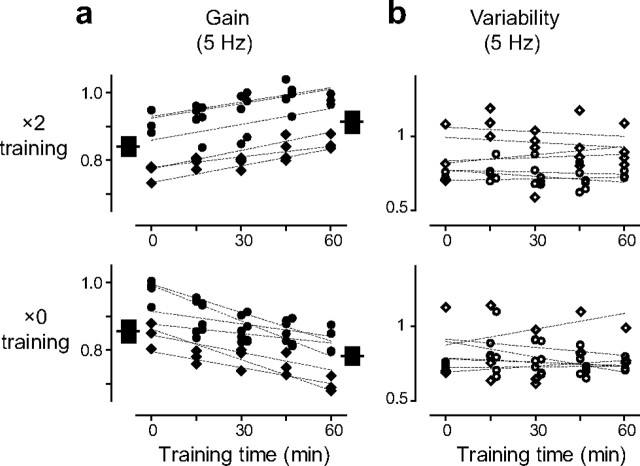
Figure 6.
Effect of training on the eye movement responses to high-frequency visual–vestibular stimuli. a, b, Gain (a) and variability (b) of eye movement responses during training with 5 Hz visual–vestibular stimuli in monkey E (circles) and monkey C (diamonds). Dashed lines are the linear fits of data points from an individual experimental session. The black boxes in a represent the mean and SEM of the eye movement responses to the vestibular stimulus alone (the VOR gain) pretraining and posttraining.

