Figure 1.
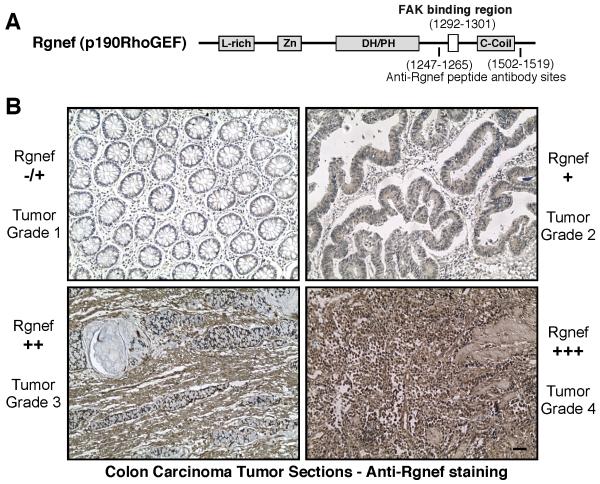
Elevated Rgnef expression during colon cancer progression. A, Schematic diagram of Rgnef (p190RhoGEF) showing locations of leucine-rich (L-rich), zinc-finger-like (Zn), Dbl/pleckstrin homology (DH/PH), and coiled-coil (C-coil) domains. Indicated is the FAK binding site (1292-1301) and the peptide regions used for polyclonal antibody production. B, Representative colon carcinoma tumor sections stained with antibodies to Rgnef (brown) reveals increased Rgnef expression (from minimal −/+ to strong +++) as a function of tumor stage. Sections were counterstained with hematoxylin (blue). Scale bar is 0.1 mm.

