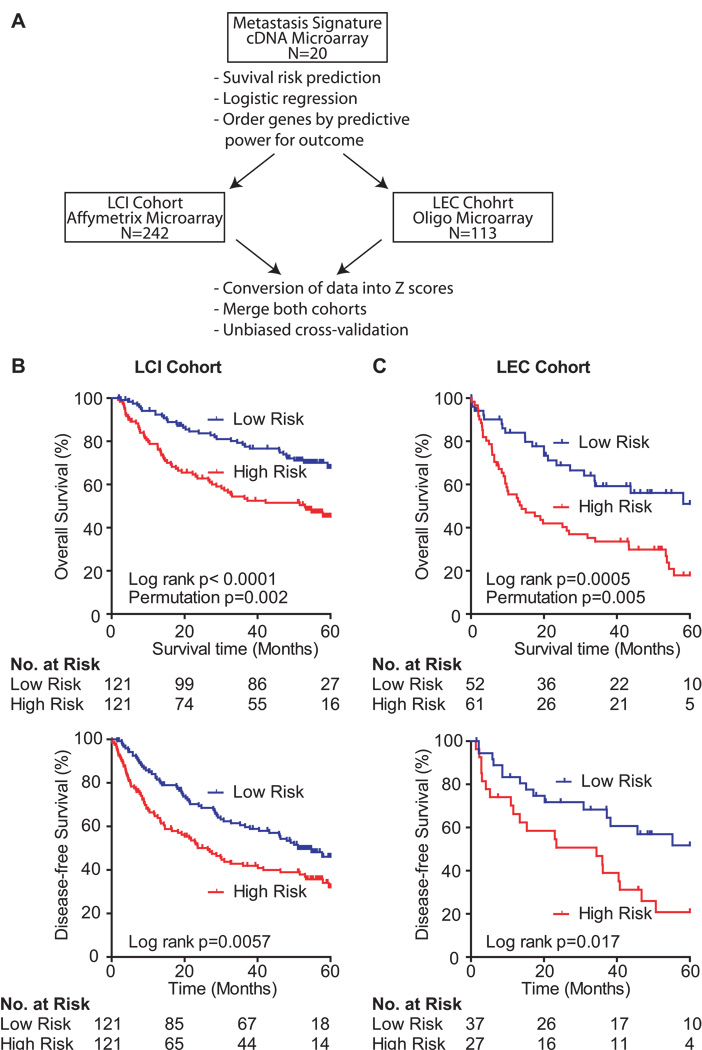
Figure 1.
Survival risk prediction analysis and application of the metastasis gene signature. (A) Schematic overview of the study design. (B) Kaplan-Meier survival curves showing the overall survival (top panel; N = 242) and the disease-free survival (bottom panel; N = 242) of the predicted high and low risk groups in the LCI cohort. (C) Kaplan-Meier survival curves showing the overall survival (top panel; N = 113) and the disease-free survival (bottom panel; N = 64) of the predicted high and low risk groups in the LEC cohort. Displayed are the Cox-Mantel log-rank, the permutation p-values and the number of patients at risk for each Kaplan-Meier survival curve.

