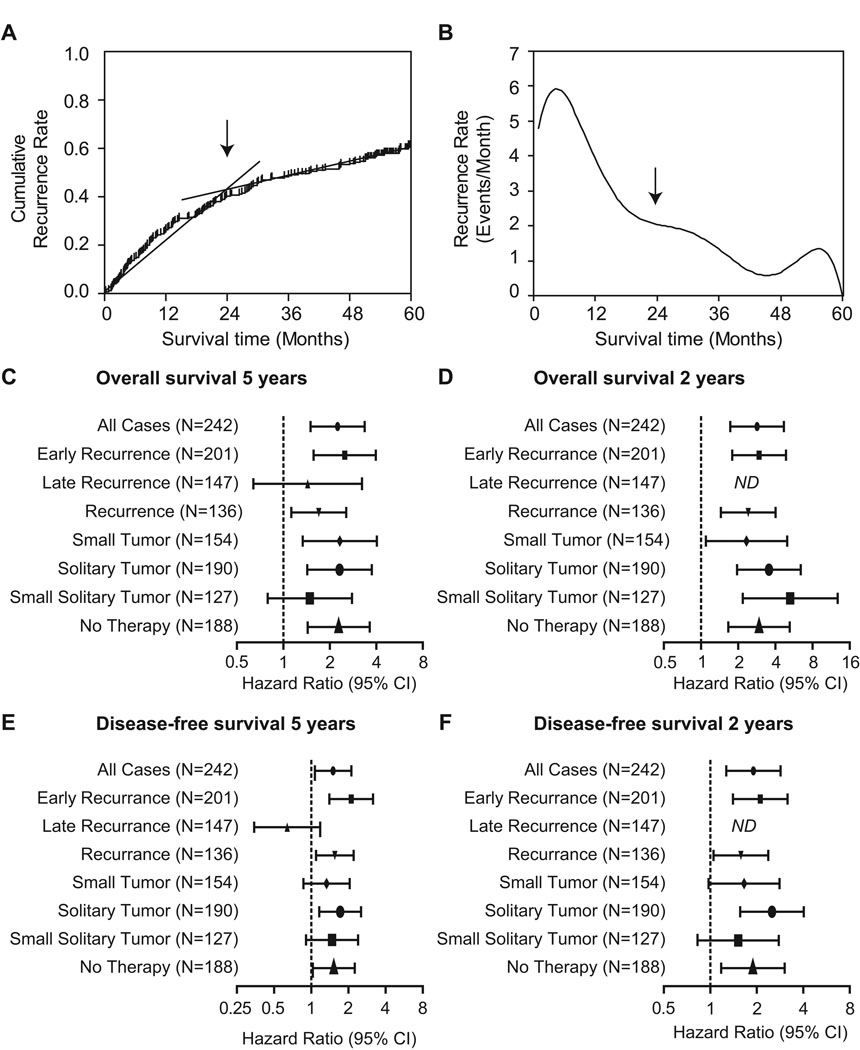
Figure 2.
Analysis of the performance of the survival risk prediction dependent on HCC tumor recurrence over time after surgery. (A) Cumulative HCC recurrence rate over time. (B) Smoothed recurrence rate per month over time. (C) Forest plots showing Hazard Ratios for high risk patients in the indicated clinical groups of patients. Hazard Ratios are shown for the overall survival at 5 years, (D) the overall survival at 2 years, (E) the disease-free survival at 5 years and (F) the disease-free survival at 2 years of follow-up of the high risk subgroup as compared with the low risk group. Hazard ratios above 1.0 indicate significantly worse outcome. ND, not determined.

