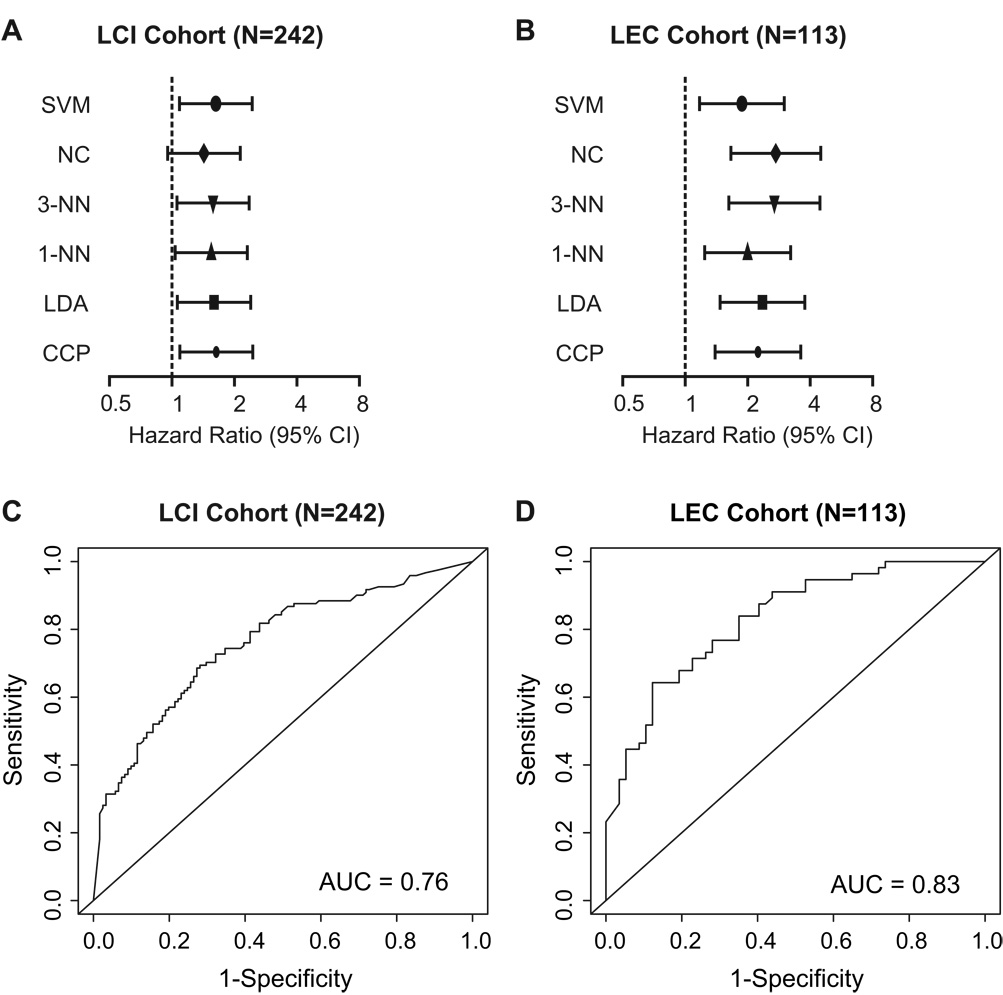
Figure 3.
Unbiased cross-validation of the survival risk prediction and analysis of the sensitivity and specificity by Receiver Operating Characteristic (ROC) curves. (A) Six class prediction algorithms, i.e., Support Vector Machines (SVM), Nearest Centroid (NC), 3-Nearest Neighbor (3-NN), 1-Nearest Neighbor (1-NN), Linear Discriminant Analysis (LDA) or Compound Covariate Predictor (CCP) were used to predict good and poor survival HCC groups in the independent validation data set. Forest plots show Hazard Ratios for high risk patients in clinical groups of patients. Hazard Ratios are shown for the overall survival for the LCI cohort at 5 years using the LEC cohort as a training/test set and predicting outcome in the LCI cohort. (B) Hazard Ratios of the LEC cohort are shown using LCI as the training/test set and prediction of the LEC cohort are depicted. (C) ROC curve of the LCI cohort and (D) ROC curve of the LEC cohort applying the compound covariate predictor. AUC; area under the curve. SVM, Support Vector Machines, NC, Nearest Centroid, 3-NN, 3-Nearest Neighbor, 1-NN, 1-Nearest Neighbor, LDA, Linear Discriminant Analysis. CCP, Compound Covariate Predictor.

