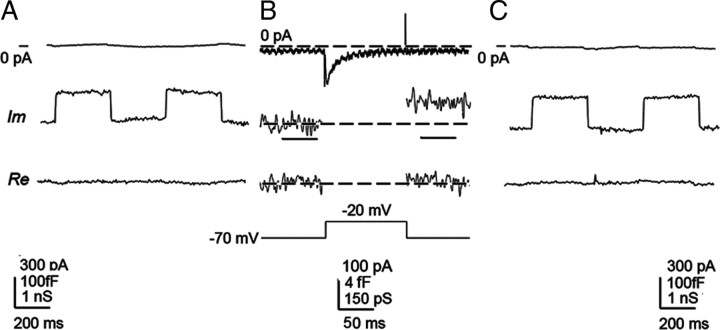
Figure 1.
Protocol for capacitance measurements. A, Membrane capacitance (Cm) measurements were performed by initially monitoring membrane current (top trace), filtered at 10 Hz (low pass, −3 dB, Bessel), at a holding potential −70 mV, to which a sine wave of 1591 Hz (11.1 mV rms) was summed. Simultaneously, we monitored imaginary (Im) and real (Re) part of admittance signals (200 Hz low pass, Gaussian filter), which were used to set the phase by the calibrated 100 fF capacitance step. B, The recording of the voltage-induced current (3 kHz, low pass, −3 dB, 2-pole, Bessel) stimulated by a voltage step from −70 to −20 mV in a type III taste cell. Note that, after the pulse application, there was a small increase in the Im part of the signal (low pass, 200 Hz, Gaussian filter), reporting a 3.26 ± 1.7 fF increase in Cm; there was, however, no change in the Re part of the signal (200 Hz, low pass, Gaussian filter). The voltage-induced change in Cm was significantly different from the Cm value before the pulse (p < 0.001, Student's t test). The horizontal bars beneath the middle Im trace show epochs of 50 ms, during which the amplitude of the change in Cm was determined. C, To test whether the application of a series of voltage pulses induced a phase shift in the measuring system, we routinely monitored the phase angle setting at the end of the recording, where signals are shown at the same settings as in A.

