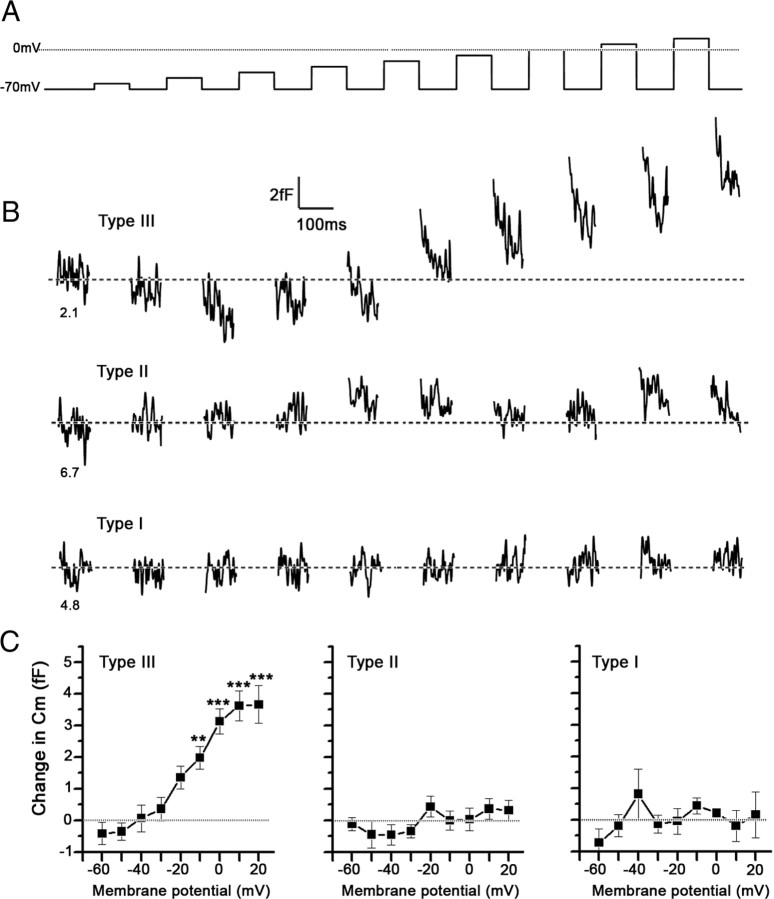
Figure 3.
Type III, but not type II and type I, taste cells exhibit voltage-induced increases in membrane capacitance (Cm). A, The sequence of voltage pulses, in 10 mV increments, applied to the taste cells clamped at −70 mV. B, Representative depolarization-induced changes in Cm (100 Hz, low pass, Gaussian filter) in type III, type II, and type I taste cells. The numbers beneath each trace represent the resting Cm of each taste cell. C, Average depolarization-induced changes in Cm in type III, type II, and type I cells, recorded in 18, 12, and 10 cells, respectively. Error bars represent SEM. The asterisks represent the significance level compared with the Cm at the first voltage step (***p < 0.001; **p < 0.01; one-way ANOVA with Tukey's multiple-comparison test).

