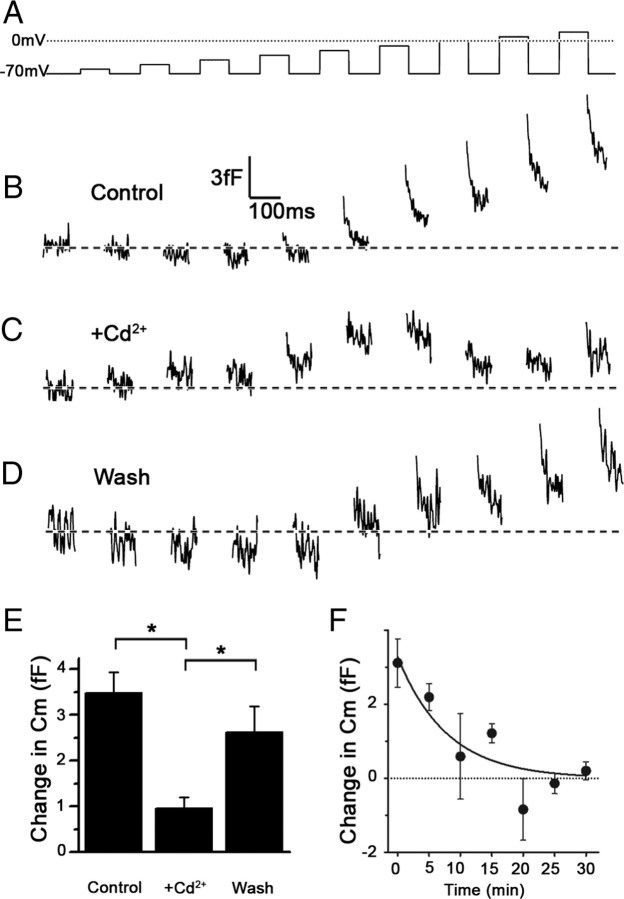
Figure 4.
Cd2+-mediated attenuation of voltage-induced changes in Cm in a type III taste cell. A, The sequence of voltage pulses applied to the taste cell clamped at −70 mV. B, Control depolarization-induced changes in Cm, recorded before the application of Cd2+ Tyrode's solution. C, Depolarization-induced changes in Cm recorded 3 min after the application of a Tyrode's solution containing 0.5 mm Cd2+. D, Recovery of depolarization-induced changes in Cm after 5 min wash of the cell with Tyrode's. The traces in B–D were low-pass filtered (100 Hz, Gaussian filter). E, Average amplitude of depolarization-induced increases in Cm, determined from the last five voltage pulses (−20 to +20 mV) on five cells was significantly reduced (p < 0.05) after the application of Cd2+. There was a significant (*p < 0.05; one-way ANOVA with Tukey's multiple-comparison test) recovery after washout of the Cd2+ Tyrode's. F, Time-dependent amplitude reduction of depolarization-induced Cm in type III taste cells (n = 6 cells). The voltage pulse protocol was applied to a single cell in 5 min intervals. The response in Cm was averaged for the voltage pulses from −20 to +20 mV. The line represents the best fit to the equation of the form: Cm (fF) = (3.28 ± 0.63)e(0.127 ± 0.047)*time(min), yielding a time constant of the decay of ∼8 min. Error bars represent SEM.

