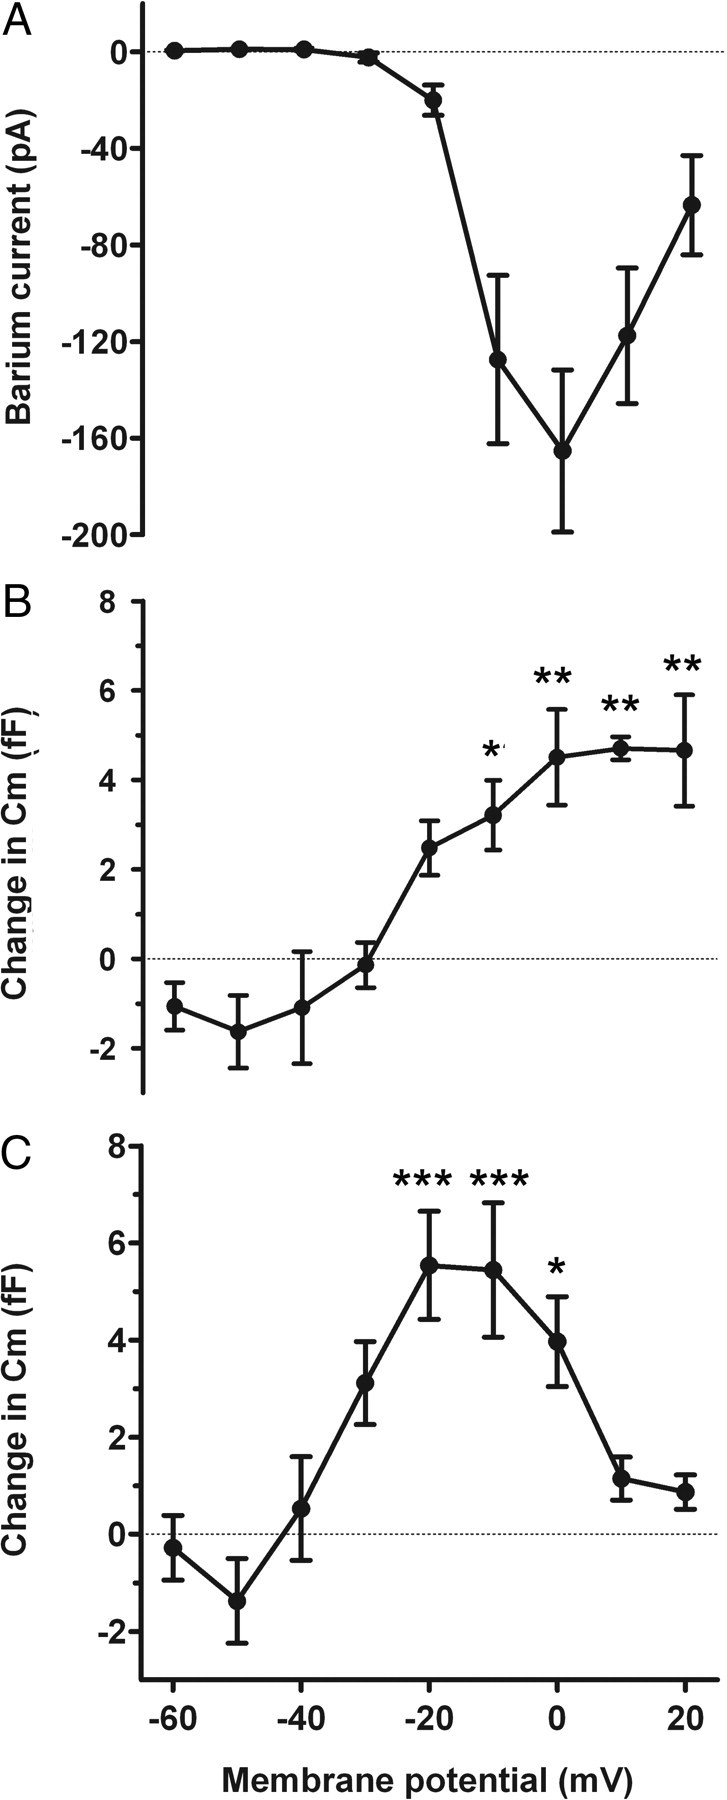
Figure 5.

Relationship between the voltage pulse-induced calcium currents and the Cm change. A, Ba2+ currents (determined in the presence of extracellular Ba2+) at different membrane potentials. B, Changes in membrane capacitance (Cm) recorded before and after the pulse were measured at the same membrane potentials in Ca2+-containing Tyrode's. Cells were held at −70 mV before stimulating them with the voltage protocol. Each value of Cm represents the average value obtained from 10 runs (n = 4 cells). C, Changes in Cm recorded after a single voltage pulse series in a different set of taste cells (n = 10 cells). Ba2+ currents are combined in A from both sets of cells. Error bars represent SEM. The asterisks adjacent to data points show the level of significance (***p < 0.001, **p < 0.01, *p < 0.05, in comparison with the response to −60 mV; one-way ANOVA with Tukey's multiple-comparison test).
