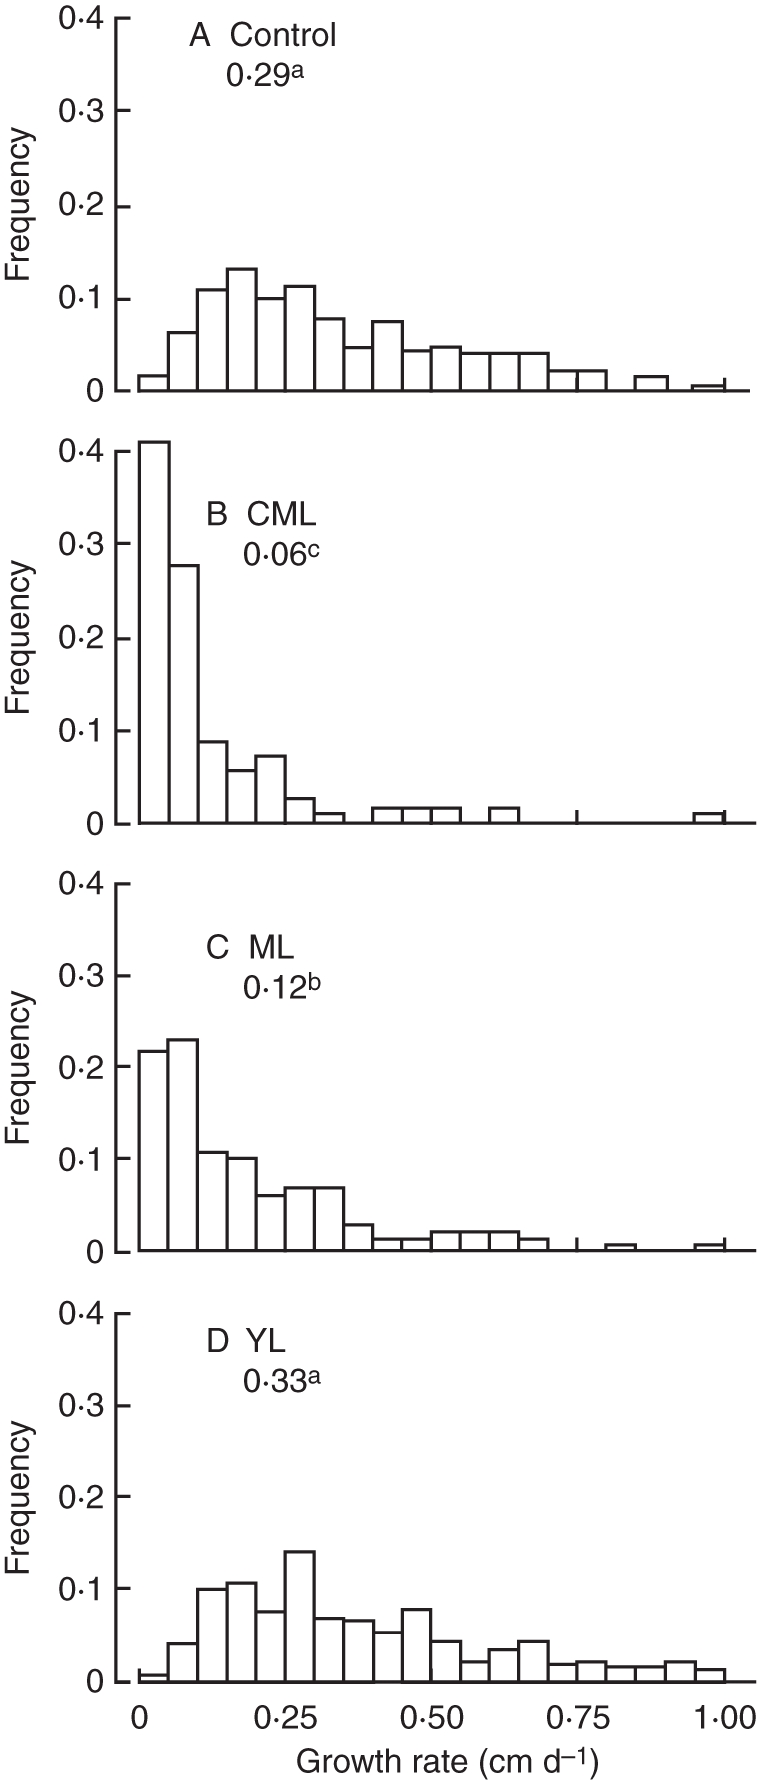
Fig. 2.

Histograms of estimated lateral root growth rate (cm d−1): (A) Control, no leaves removed; (B) CML, removal of cotyledons and mature leaves; (C) ML, removal of mature leaves; (D) YL, continuous removal of young leaves. Values on each histogram are the median growth rate for the corresponding treatment; values with the same letter indicate non-significant differences (crossed Kolmogorov–Smirnov test, P < 0·01).
