
Fig. 4.
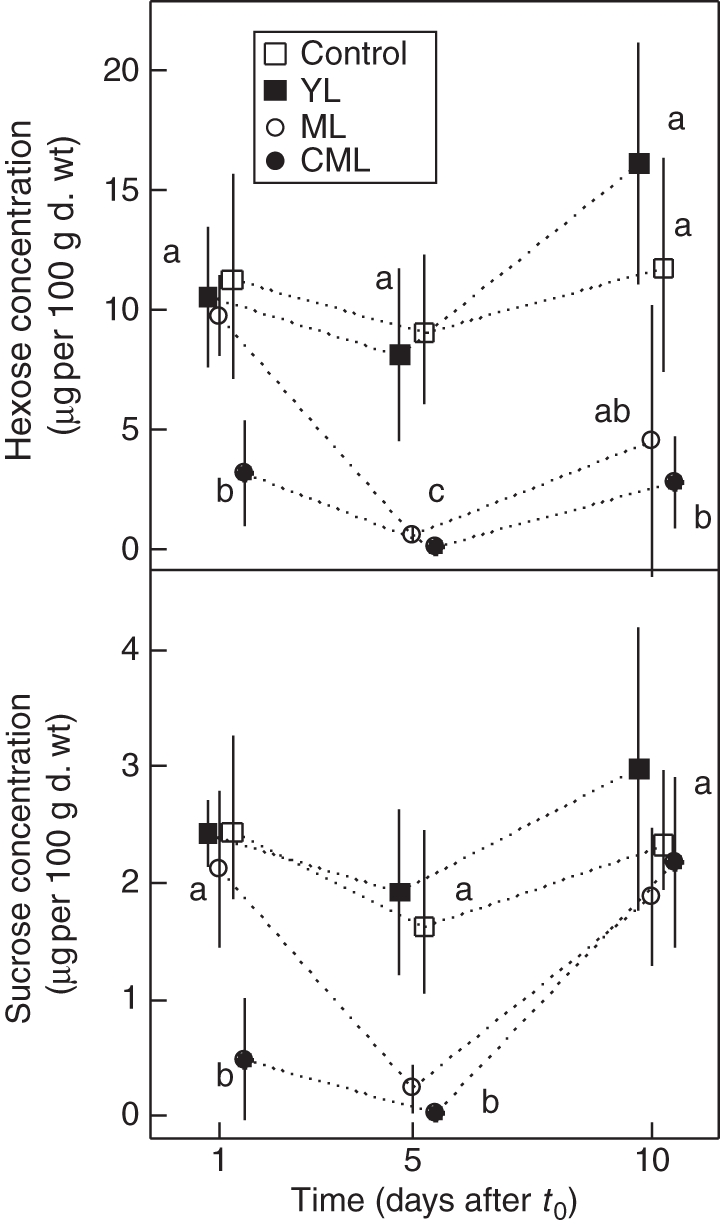
Mean (± s.d.) hexose and sucrose concentrations in taproot subapical segments (n = 45) collected at different times after t0 (1, 5, 10 d) for control, YL, ML and CML seedlings, as indicated. In each graph, values with the same letter indicate non-significant differences (crossed Student's t-test, P < 0·05).