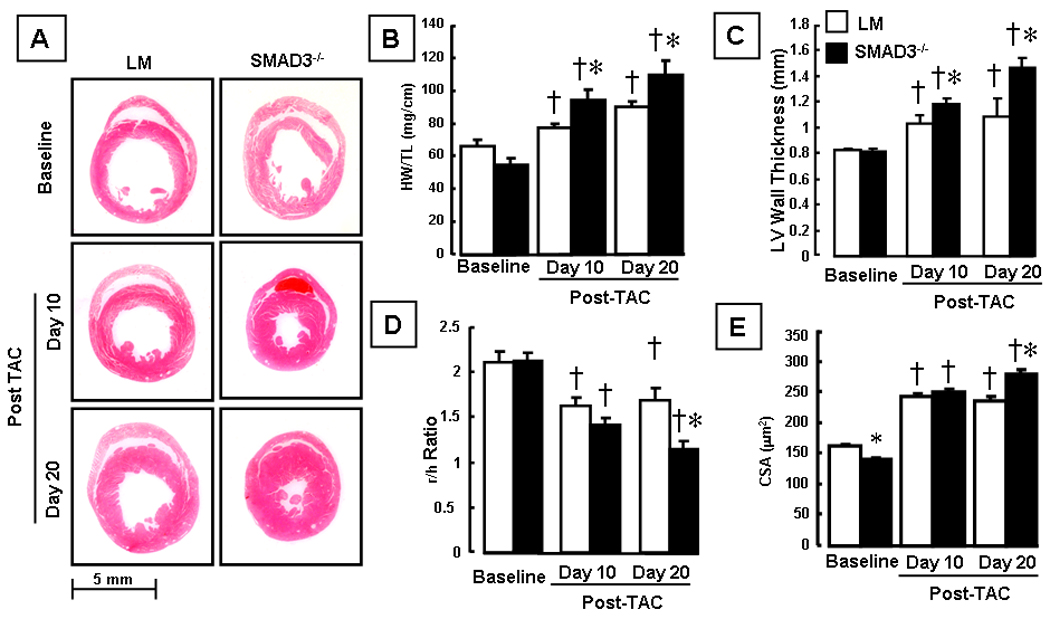
Figure 2.

Effect of hemodynamic pressure overload on cardiac structure. Panel A: representative hematoxylin and eosin stained myocardial sections of littermate (LM) and SMAD3 −/− mice at baseline and 10 days and 20 days post-TAC. Panel B: Heart weight to tibial length ratio (HW/TL) at baseline, 10 days and 20 days post TAC in LM and SMAD3 −/− mice (n= 9 to 16 mice/group). Panel C: 2-D echocardiographic determined LV wall thickness at baseline, 10 days and 20 days post TAC in LM and SMAD3 −/− mice (n = 3–13 mice/group/time). Panel D: 2-D echocardiographic determined LV radius divided by LV wall thickness (r/h ratio) at baseline, 10 days and 20 days post TAC in LM and SMAD3 −/− mice (n = 3 mice/group/time). Panel C: Myocyte cross-sectional area (CSA, :m2) at baseline, 10 and 20 days post-TAC in LM and SMAD3 −/− mice (n = 100 myocytes/group/time). († = p < 0.01 vs baseline; * = p < 0.01 vs same group at a given time point).
