
Figure 4.
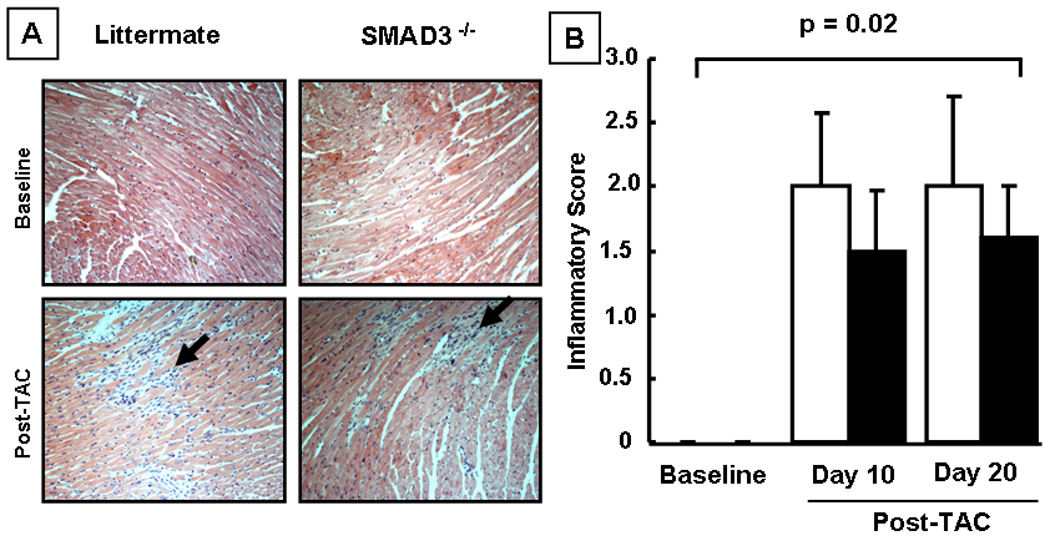
Effect of hemodynamic pressure overload on myocardial inflammation. Panel A: representative hematoxylin and eosin stained myocardial sections of littermate (LM) and SMAD3 −/− mice at baseline and 10 days post-TAC (arrows depict inflammatory cells). Panel B: group data of the semi-quantitative inflammatory scores at baseline, 10 and 20 days post TAC (n = 5 – 10 mice/group/time). NS = non-significant