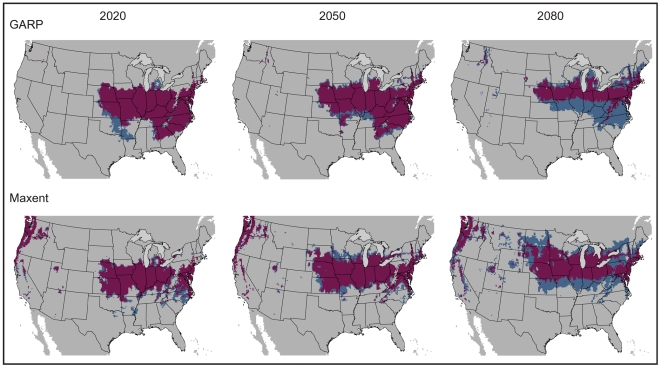
Figure 4. Model agreement between climate change scenarios per time slice.
GARP results are depicted above, with Maxent models below. The two climate change scenarios (a2a and b2a) are compared, with area of overlap indicated in maroon, for the three time slices: 2020, 2050, and 2080. A threshold has been applied, allowing for a maximum of five percent omission error based on presence data. Results are depicted in USA Contiguous Albers Equal Area Conic map projection.

