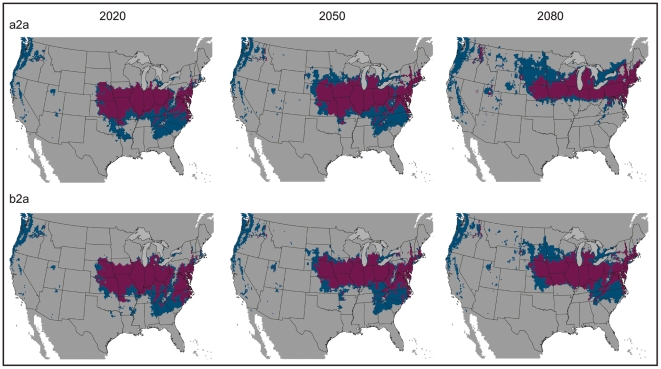
Figure 5. GARP-Maxent model agreement for each time slice and scenario.
Maroon signals agreement; thus, blue areas are where Maxent predicted suitable habitat, but not GARP, or vice versa. A threshold has been applied, allowing for a maximum of five percent omission error based on presence data. Results are depicted in USA Contiguous Albers Equal Area Conic map projection.

