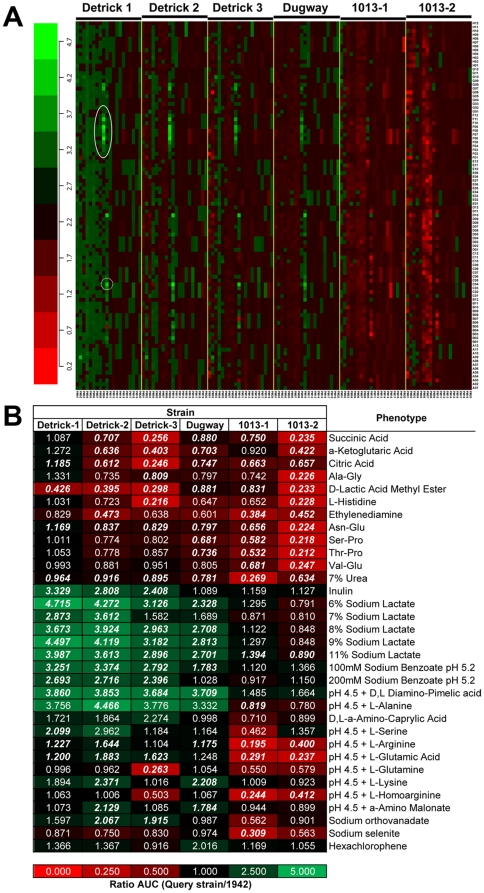
Figure 6. Omnilog phenotypic arrays of B. atrophaeus subsp. globigii strains.
Six strains were each inoculated into twenty 96-well Omnilog plates and grown at 37°C. Reduction of tetrazolium dye by respiring cells was measured every 15 minutes by optical density. Dye reduction relative to the 1942 strain is shown; the red ratio values indicate less respiration while the green ratio values indicate more respiration as compared to the 1942 strain. Individual arrays or strains are displayed in each of the six major columns labeled Detrick 1, Detrick 2, Detrick 3, 1013-1, 1013-2, and Dugway. A) Heat map of all conditions for each strain. Each of the twenty plates for each strain is represented by the notation PM01-PM20 (left-to-right for each strain) along the x-axis. The rows represent the well position, and are denoted as Ai to Hi (i = 1 to 12) from the bottom to the top of the plot in each array along the y-axis. Each cell ratio value represents the average of two biological replicates for each strain. Plates PM01-PM10 contains single wells for each growth condition, while plates PM11-PM20 contain quadruplicate wells for each growth condition. Solid circle indicates wells containing sodium lactate; dotted circle indicates well containing L-serine at pH 4.5. The details of the 1920 growth conditions can be found in the first worksheet labeled “All strain AUC data” in Table S4. B) Most significant phenotypes for each of the six test strains as compared to the 1942 strain. The phenotypes with statistically significant increases and/or the decreases in ratio values for each of the six strains are presented. For the 1013 isolates only the conditions giving the five largest changes are presented. The number in each color block indicates the ratio for the test strain relative to the parent strain for the phenotype specified. The details of all significant phenotypes for each test strain can be obtained in Table S4. Bold Italic font indicates p<0.05.

