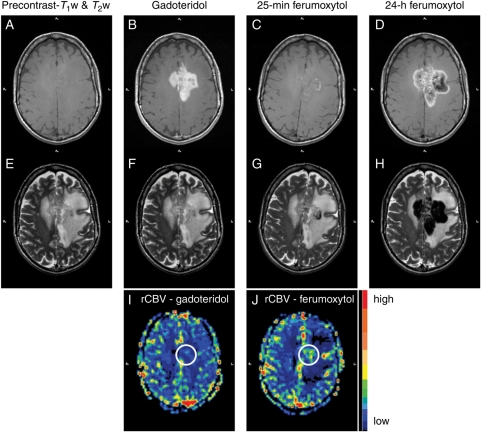
Fig. 1.
Patient 8 with glioblastoma multiforme. (A and B) Nonenhanced (A) and gadoteridol-enhanced (B) T1-weighted images of a left frontoparietal mass, which crosses the midline. The gadoteridol-enhanced image shows evidence of strong enhancement. (C) Twenty-five minutes after ferumoxytol administration, the T1-weighted image demonstrates some faint, mainly punctate, enhancement within the mass. (D) Twenty-four hours after ferumoxytol injection, mixed SI changes are seen in the approximate region where gadoteridol enhancement is noted. (E–H) T2-weighted images obtained before (E) and after gadoteridol (F), 25 minutes (G), and 24 hours after ferumoxytol injection (H). Twenty-five minutes after ferumoxytol administration, the T2-weighted image shows some punctate and a curvilinear hypointensity within the mass. Twenty-four hours after ferumoxytol injection, strong lobulated areas of decreased signal are observed. The distribution of low SI areas is similar to that of mixed high and low SI areas on the T1-weighted image in (D). (I and J) Color-coded rCBV parametric maps. The ferumoxytol-rCBV parametric map (J) shows high blood volume within the tumor, while the gadoteridol-rCBV parametric map (I) does not.

