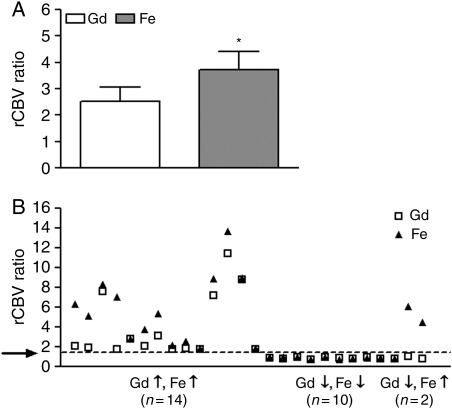
Fig. 6.
Analysis of dynamic susceptibility contrast MR images. (A) The ferumoxytol-rCBV values were significantly higher (*, P = .0016) compared with the gadoteridol-rCBV values. The paired t-test was used. rCBV, relative cerebral blood volume; Gd, gadoteridol; Fe, ferumoxytol. (B) The rCBV values were elevated both with ferumoxytol and with gadoteridol in 14 patients, they were low with both contrast agents in 10, and there was a discordance between them in 2 participants. The arrow indicates a threshold rCBV ratio of 1.75. rCBV, relative cerebral blood volume; Gd, gadoteridol; Fe, ferumoxytol.

