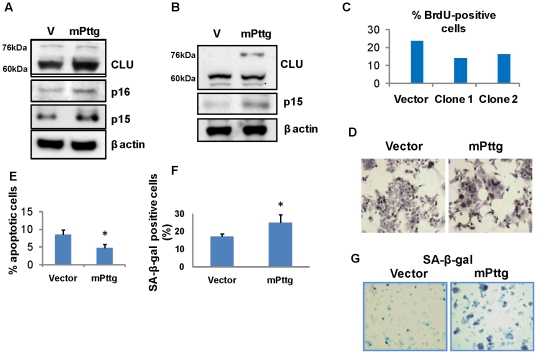
Figure 5. Senescence markers in gonadotroph-derived LβT2 cells transfected with mPttg.
Western blot analysis of senescence markers in A) LβT2 cells transiently transfected with mPttg; B) in LβT2 cells stably transfected with mPttg; C) Percent BrdU positive cells in two selected clones stably transfected with mPttg. Duplicate samples were pulsed with BrdU for 30 min and analyzed by flow cytometry; D) Senescent morphology of LβT2 cells stably transfected with mPttg. Brown dots depict incorporated BrdU; E) Percent apoptotic cells stably transfected with mPttg. Cells were fixed, and one thousand cells/field counted in three randomly chosen visual fields; F) Percent SA-β-galactosidase positivity in cells stably transfected with Pttg was assessed in 6-well plates in triplicate. One thousand cells/field were counted in three fields/well. G) SA-β-galactosidase enzymatic activity (blue) in cells stably transfected with mPttg. *, p<0.05.

