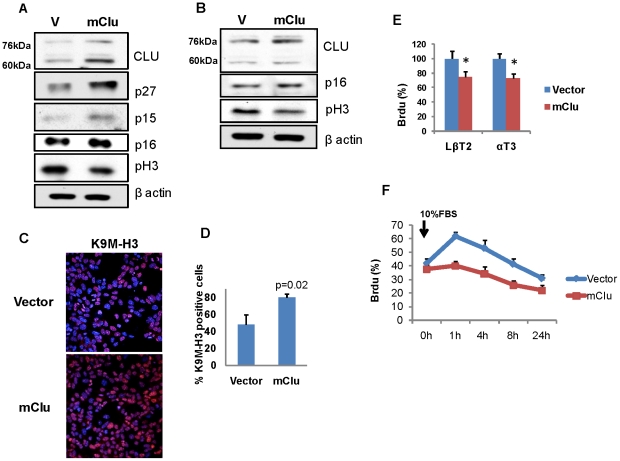
Figure 7. Clusterin restrains pituitary cell proliferation by inducing Cdk inhibitors.
Western blot analysis of Cdk inhibitors and proliferation markers A) in LβT2 cells, B) in αT3 cells 48 h after transfection with mClu; C) Confocal images of immunofluoprescence of histone H3 methylation on lysine 9 (H3-K9M) (red) in vector and Clu-expressing αT3 cells 48 hours after transfection; D) Quantification of positive H3-K9M foci. Cells were fixed, stained with H3-K9M antibody, and one thousand cells/field counted in three randomly chosen visual fields; E) Percentage of BrdU positive cells 48 h after transfection with mClu. Triplicate samples were pulsed with BrdU for 30 min and analyzed by flow cytometry, *, p<0.05; F) αT3 cells stably overexpressing mClu or vector were synchronized in 0.1% fetal bovine serum for 18 hours, and then cultured in 10% fetal bovine serum. At the indicated times, duplicate samples were pulsed with BrdU for 30 min, analyzed by flow cytometry, and cells in S-phase identified by staining with BrdU antibodies.

