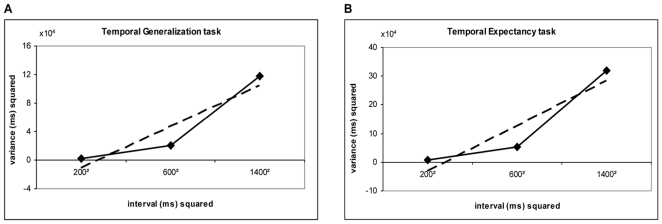
Figure 5. Mean variance increases as a function of duration for both explicit and implicit timing.
Subjects' mean variance squared is plotted as a function of the standard duration squared for the Temporal Generalisation (explicit timing) and Temporal Expectancy (implicit, predictive timing) tasks. Trend lines (dashed) for linear functions are also shown.

