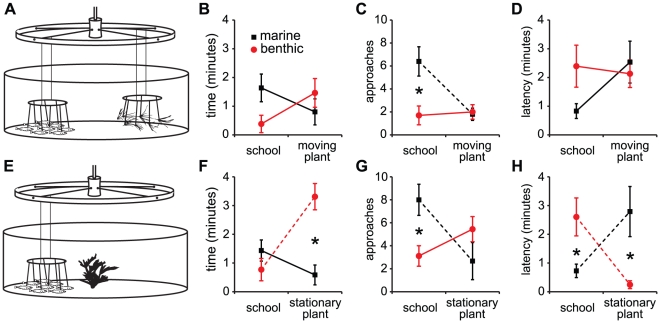
Figure 5. Marine and benthic sticklebacks display different preferences for social and non-social stimuli.
(A,E) Schematic diagrams showing assays used for testing preference for the model school or plant stimuli using either (A) moving (marine: n = 10, benthic: n = 10) or (E) stationary plant (marine: n = 9, benthic: n = 9) choices. (B,C,D) results from moving plant trials and (F,G,H) results from stationary plant trials. (B,F) time spent with school or plant; (C,G) number of approaches to school or plant; (D,H) latency to approach school or plant. Black symbols and lines represent marines; red represent benthics. A dashed line indicates a significant pairwise comparison between plant and school for a single population. An asterisk indicates a significant pairwise comparison between benthic and marine for a single stimulus.

