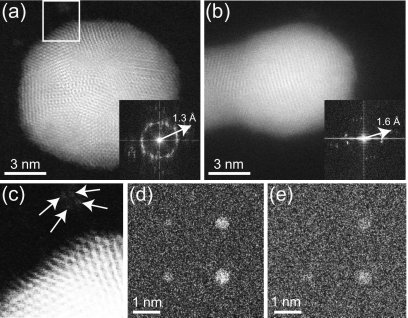
Figure 3.
The effect of beam broadening. (a) STEM image of gold nanoparticles on top of a 100-nm-thick SiN membrane. The FFT is shown in the inset. (b) Image recorded at the bottom of the SiN membrane in (a), with the FFT shown in the inset. (c) Magnified image of the area selected by the rectangle in (a) showing four single atoms indicated by the arrows. (d) Monte Carlo simulations of gold nanoparticles with diameters of 0.3, 0.4, 0.5, and 0.6 nm placed in a 2×2 matrix at the bottom of a SiN membrane of 50 nm. (e) Same as in (d), but then for a membrane thickness of 100 nm.

