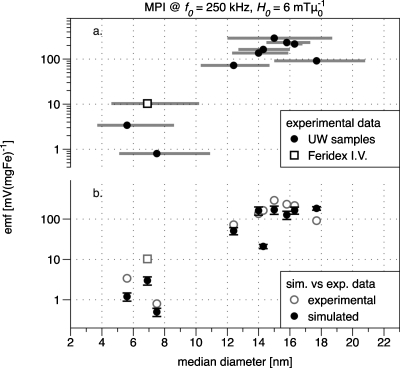
Figure 4.
(a) MPI signal testing results. Symbols represent MNP samples (particle details are listed in Table 1). The error bars in x are not uncertainty, but rather delineate the first standard deviation of the sample diameter distribution. (b) Simulated data for each experimental sample with measured points duplicated (in gray) for reference (see the text for simulation parameters).

