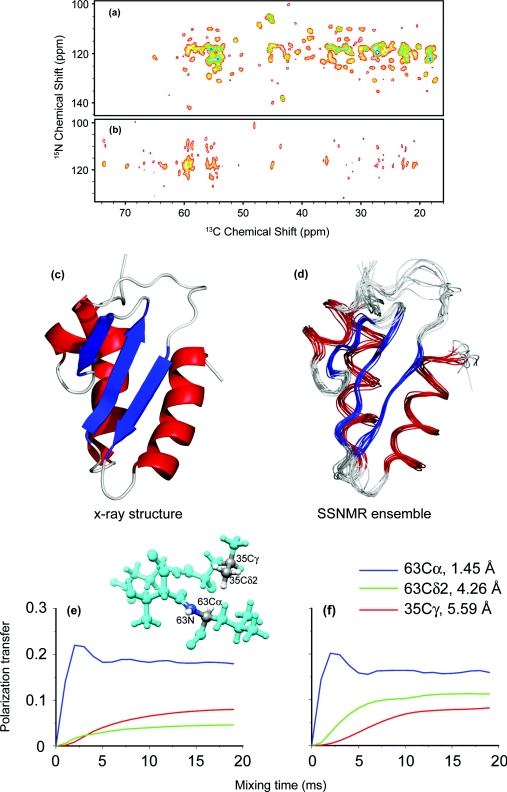
Figure 14.
2D 15N–13C correlation PAIN-CP spectra on [U–13C,15N] (a) and heterogeneously 50%/50% [U–13C]/[U–15N] labeled (b) Crh. (a) was obtained at ω0H/2π = 750 MHz, ωr/2π = 20 kHz with 15 ms mixing time. (b) was obtained at ω0H/2π = 900 MHz, ωr/2π = 20 kHz. The spectrum in (b) is a sum of experiments with mixing time of 5 and 10 ms. (c) Crh x-ray structure [PDB entry: 1MU4 (Ref. 30)] and (d) solid-state NMR structures of an isolated monomer. 15N–13C PAIN-CP buildup curves for the spin system [see panel (e)] composed of one nitrogen, three carbons, and five protons without (e) and with fast methyl rotation (f). The magnetization starts on the L63N spin and is distributed to the L63Cα (directly bonded), the L35Cδ2 (4.26 Å distant), the L35Cγ (5.59 Å distant). The three rf power levels of the CW irradiations are chosen based on optimization maps (see Fig. SI 2) (Ref. 26). The rf power level settings (in units of the MAS frequency) are pC = pN = 2.9 pH = 2.45 (δp0 PAIN-CP).

