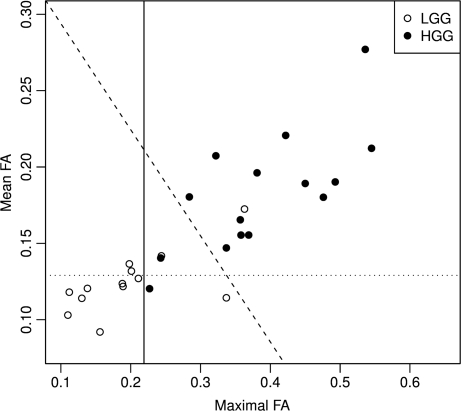
Fig. 3.
Scatter plot of maximal FA and mean FA in nonenhancing LGG and HGG with discriminant lines. The vertical line represents cutoff value = 0.219 for maximal FA. The horizontal line represents cutoff value = 0.129 for mean FA. The oblique line represents cutoff value = 0.0 for the linear discriminant score (bivariate(mean FA + maximal FA)), which separates LGG from HGG better than either maximal FA or mean FA alone.

