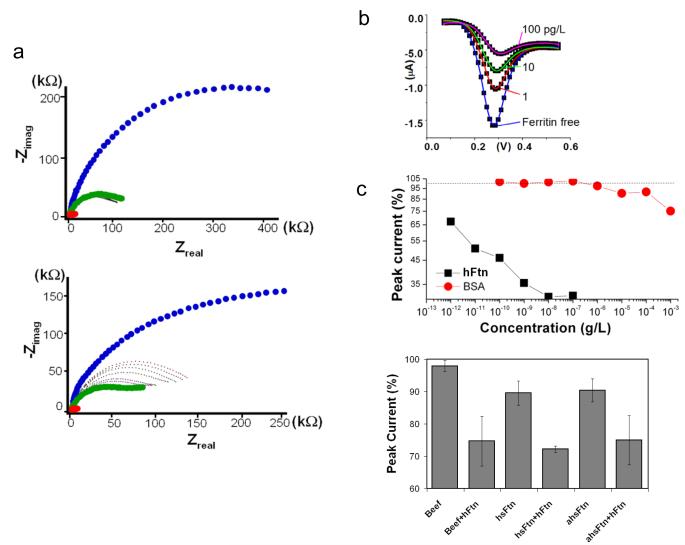
Figure 2.
Detection of hFtn using molecular imprinted nanosensor. a, Nyquist plots of nanosensor response (f scanned from 1 Hz to 1 MHz). Traces correspond to measurements without PPn (red), hFtn entrapped in PPn (blue), hFtn removed from PPn (green), and application of BSA (upper graph, black tracing) from 10−10 to 10−4 and hFtn (lower graph, dotted tracings) from 10−12 to 10−7 g/L. Data represent three independent determinations. b, DPV current responses to different hFtn concentrations. c, Protein concentration-dependent peak current response represented as the percentage of peak current (%) vs. concentration (g/L) on log-log scales. d, DPV current responses to hFtn in binary mixtures. The final concentration of hFtn and individual interferent proteins corresponded to 10−8 g/L and 10−6 g/L, respectively. Beef: bovine muscle protein extract; hsFtn: horse ferritin; ahsFtn: horse apoferritin; hFtn: human ferritin. Data represented as standard error of the mean (n=3).

