
Fig. 4.
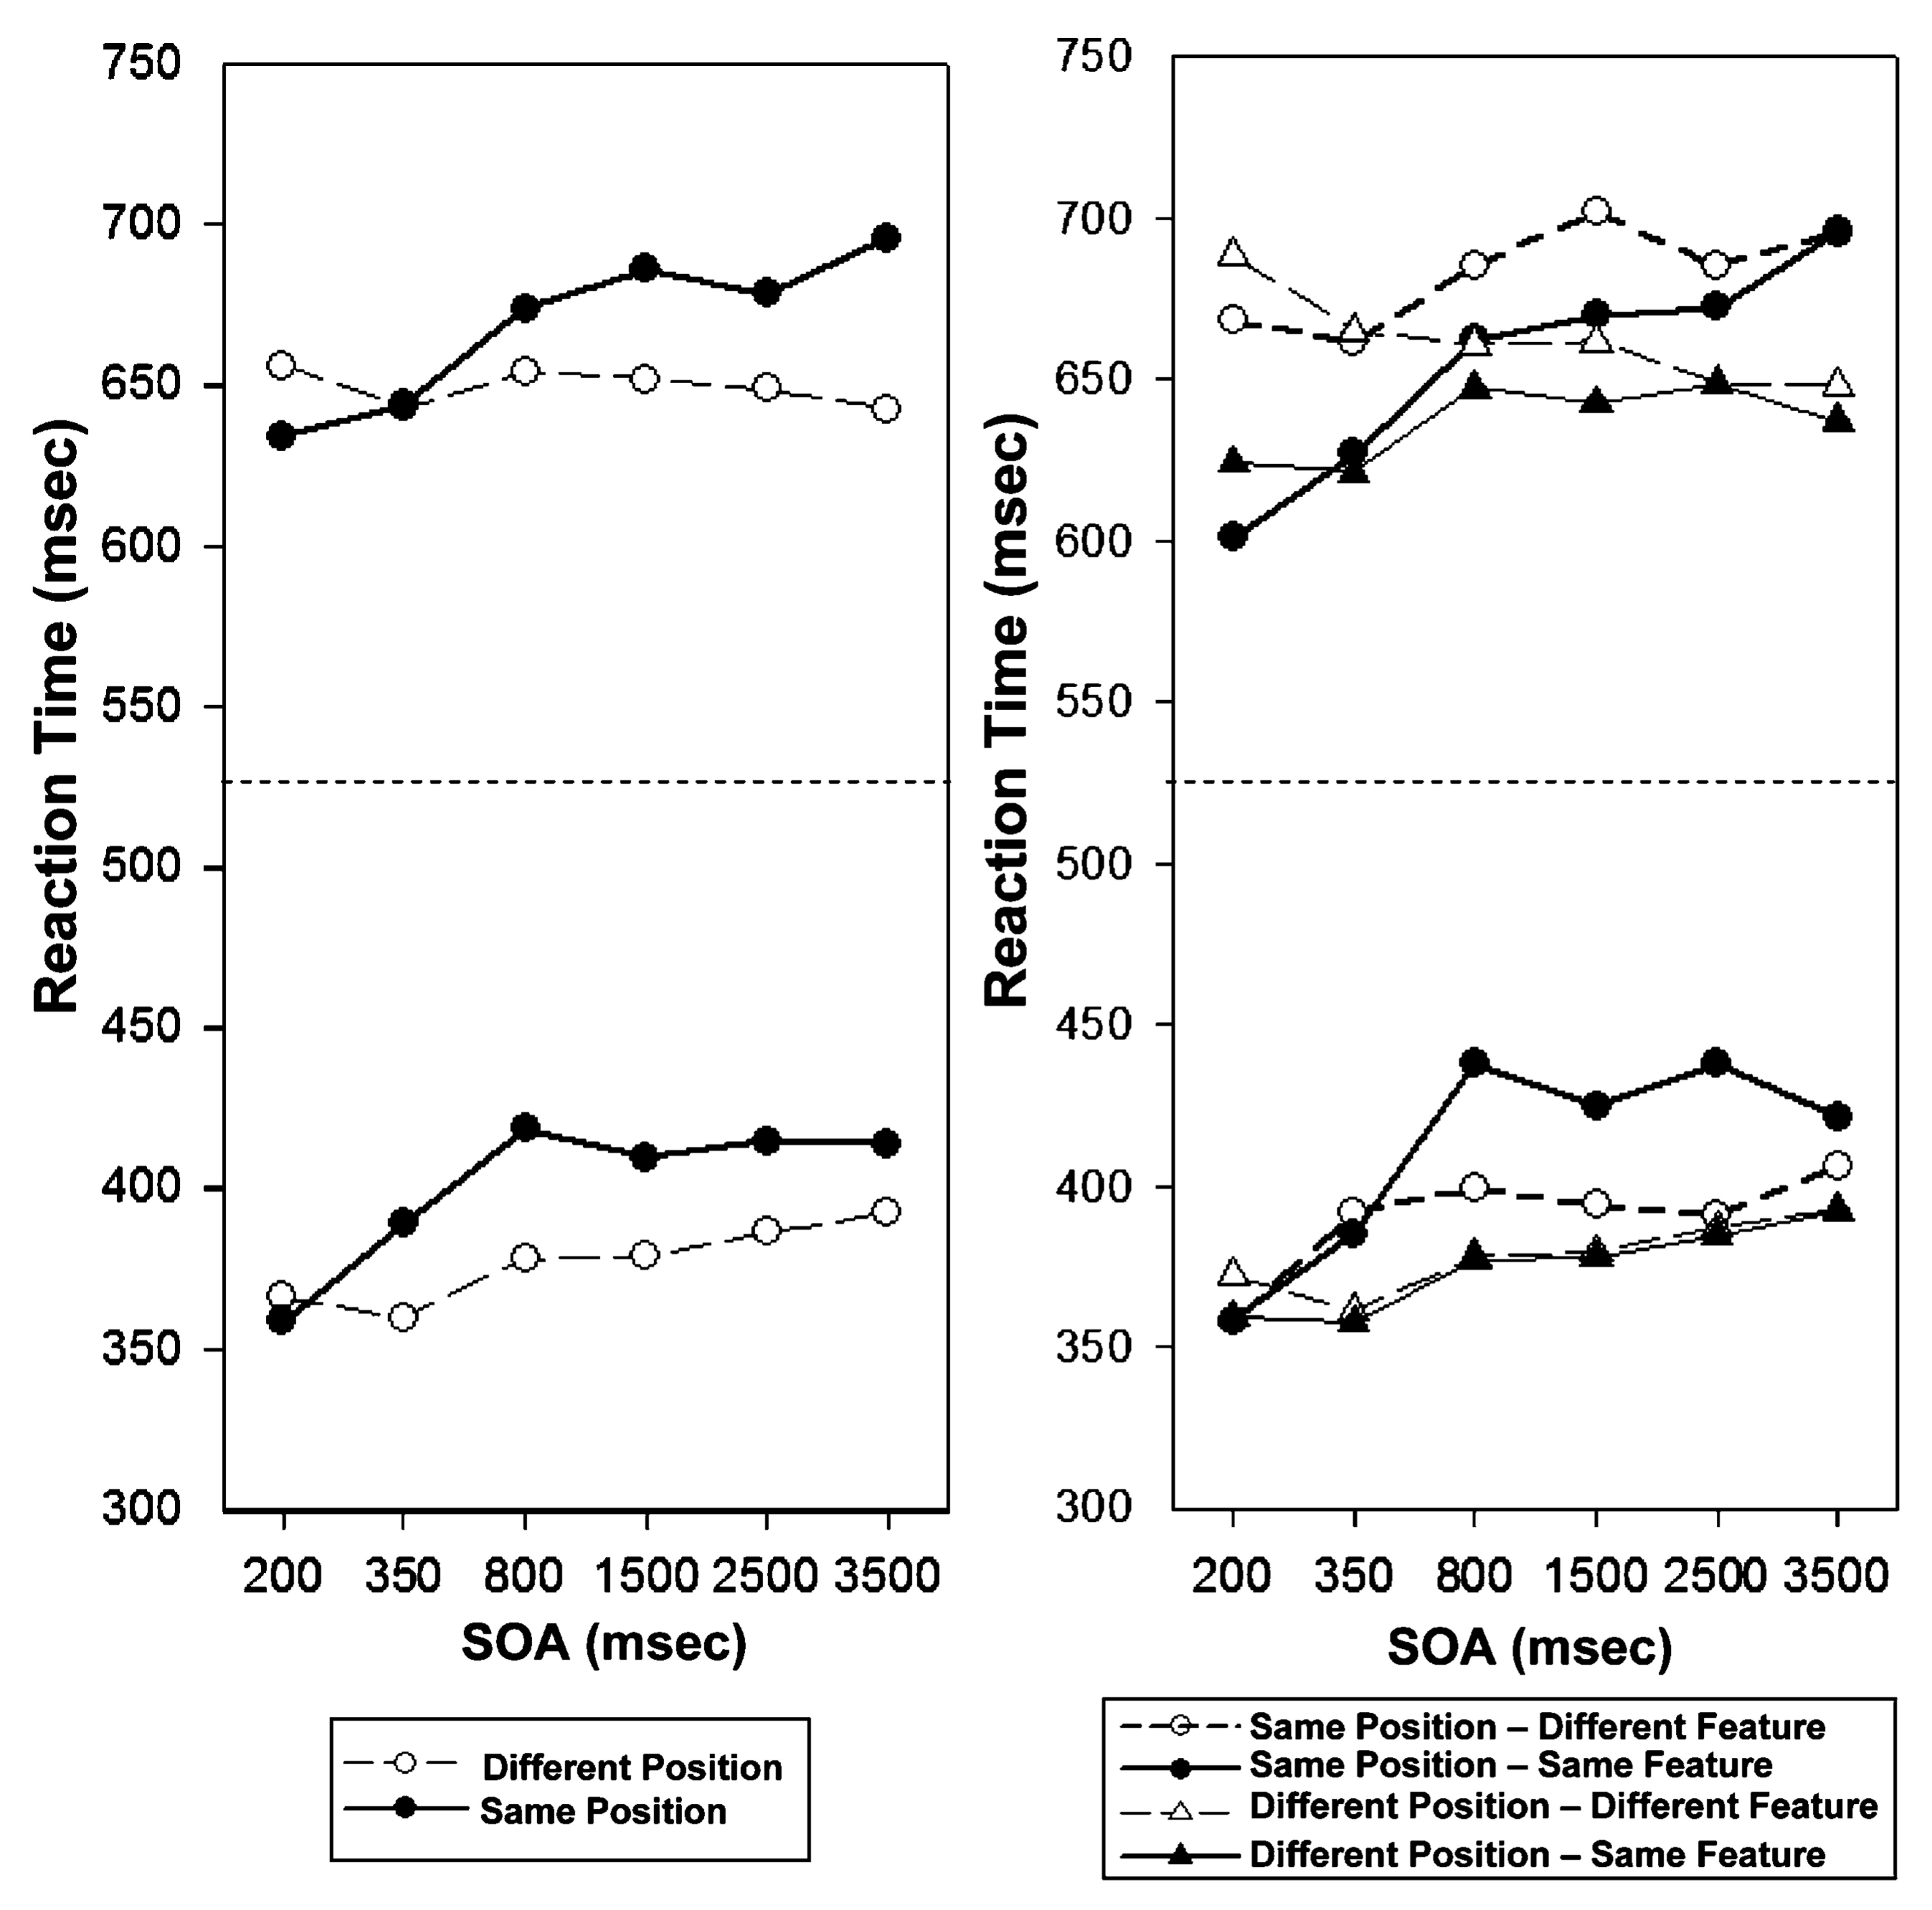
Different repetition effects in Discrimination tasks (top panels) and Detection tasks (bottom panels; adapted from Hu et al., 2010): a summary. Left side the mean target detection/discrimination times, broken down by cue-target location relationship (same, different) and stimulus onset asynchrony (SOA). Right side the mean target detection/discrimination times, broken down by cue-target location relationship (same, different), feature (repetition, nonrepetition), and stimulus onset asynchrony (SOA)